
IREN −50%, INTC −39.5%, TSLA +2.1%: the algorithm made 20%+ on each
The Market Wave Algorithm for Equities beat buy and hold and dollar-cost averaging on three stocks with three different stories, June to November 2026.
November 2026. Three stocks you have an opinion about. The swings did not ask.
Why this series, and why now
Every investor has a stock they love and a stock they would never touch. The opinion decides what you hold. It does not decide what you earn. What you earn comes from how the price moves while you hold it, and every stock moves, the loved ones and the hated ones alike.
This study takes three stocks most readers have a view on and shows what happened inside them over one summer: the swings, the headlines that ran during each swing, and what a rules-based algorithm did with the swings while the headlines ran.
The four-swing slide
Strategy+24.1%
- Buy and hold
- −50%
- DCA
- −43.1%
Two dips, one rally, out before the fall
Strategy+24.2%
- Buy and hold
- −39.5%
- DCA
- −33.4%
Five months, nowhere, four swings
Strategy+29.5%
- Buy and hold
- +2.1%
- DCA
- +5.8%
All three from the same hypothetical $100,000 in cash and zero shares.
Backtested results. Past performance does not guarantee future results. For educational purposes only.
The movement
The movement in this study is the swing inside a trend. The stock is going somewhere over months, and on the way it drops 10% to 40% and bounces back 20% to 50%, several times. A holder lives through every leg. The algorithm trades the legs.
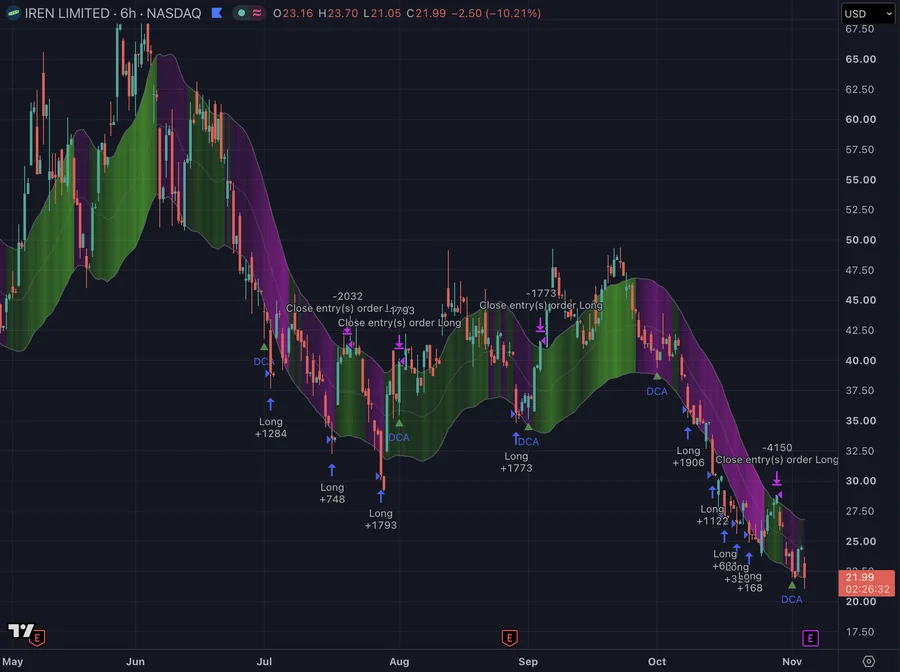
IREN Four swings in four months. Down about 30%, up about 50%, down about 25%, up about 35%, then down about 55%. Ends at half its starting price.
- 1Aug 31 "IREN Limited Keeps Falling: A Respected Ratings Agency Sees 185% Growth Anyway" 24/7 Wall St
- 2Sep 26 JPMorgan upgrades to Overweight 24/7 Wall St
- 3Oct 21 "IREN Limited Crashed 40% This Month: Three Wall Street Analysts Agree It's Going to Quadruple" 24/7 Wall St
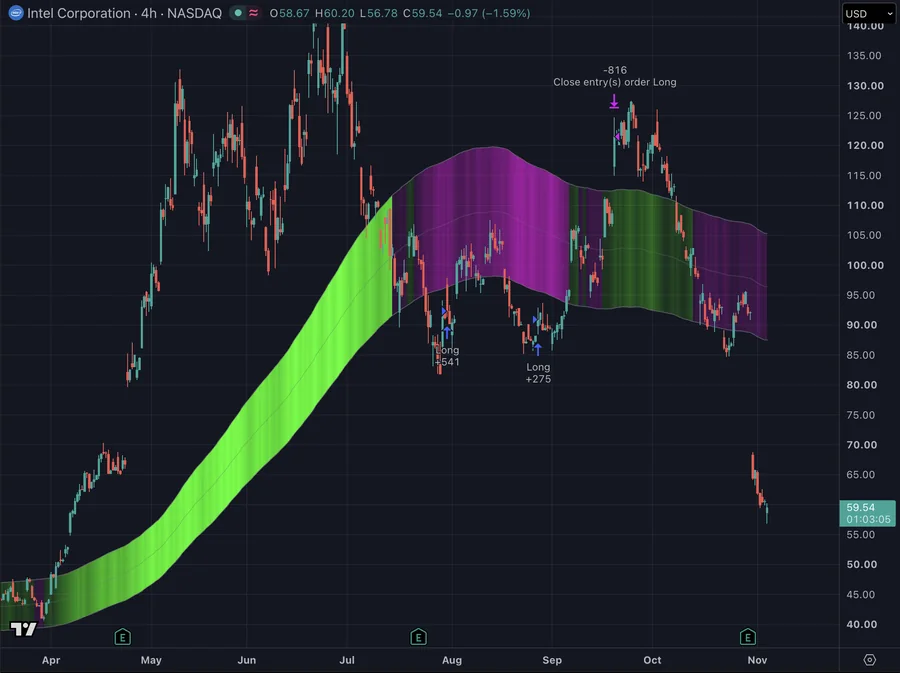
INTC Two shallow dips of about 12%, one rally of about 45%, then a fall of about 50%. Ends down 40%.
- 1Sep 19 CEO says Intel can meet "about half" of server CPU demand Motley Fool
- 2Oct 7 "Why Intel Rallied in September" (up 34.3% for the month) Motley Fool
- 3Oct 29 Q3 beats on earnings; next day the stock falls 28.6% Forbes
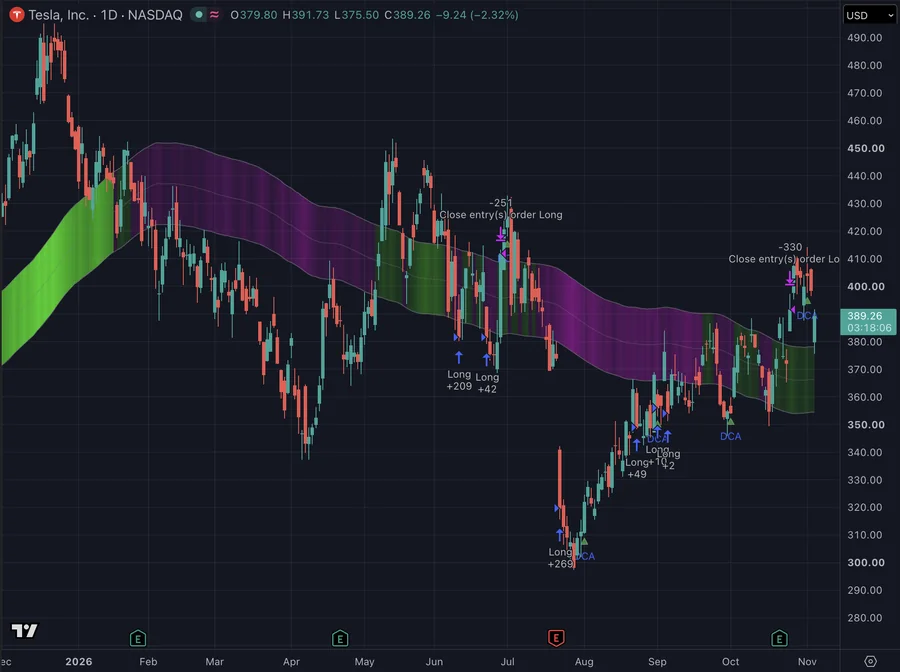
TSLA A 25% drop, a 25% recovery, a 15% dip, a 20% climb. Ends within 2% of where it started.
- 1Late July Q2 report, deliveries recover and margins compress Motley Fool
- 2Sep 3 "Why Tesla Stock Surged 18% in August" Motley Fool
- 3Sep 4 "Tesla's stock drops 6% as Cybercab update 'underwhelms' Wall Street" CNBC
Here is the catch that matters for this study: read the headlines in order and try to place the trades. You cannot. The best news on each stock ran during a drop, and the worst ran after the bounce had already started.
The opinion trap
The thesis anchor
You researched the company, so you hold through the drop. The thesis is why you bought and it becomes why you cannot sell. IREN's holder read three analysts calling for a quadruple while the stock lost half its value.
The headline reflex
The news feels like a signal because it arrives with a date and a number. Intel beat on earnings on Oct 29 and fell 28.6% on Oct 30. Tesla rose 18% in August on the robotaxi story and fell 6% the day the Cybercab launched. The headline told you what happened. It never told you what the price would do.
The wrong question
Is this a good company is a question you answer once. How is it moving is a question the price answers every day. TSLA went nowhere in five months and still offered four tradeable swings.
Dollar-cost averaging deserves credit. It removes the timing decision and keeps you buying through the fear. Its cost is structural: it buys blind, never sells, and never realizes a gain. In two of these three stocks it lost a third of its money.
A rules-based algorithm restores the second question. It does not read the news. It reads the price.
The algorithm
Ride confirmed moves
The Market Wave band defines the current trend. Entries are taken below it, exits above it, only after a move of a set size.
Exit on rules, not nerves
Every exit is a threshold crossed, never a reaction to a headline.
Step aside in chop
When no move clears the threshold, the algorithm holds cash and waits.
The algorithm reads price, never news. The recipe sets how big a swing counts: scope 1 catches the small, fast swings in IREN; scope 7 with a trend filter waits for the large, slow ones in INTC; scope 5 sits between for TSLA. Thresholds and trade size follow the same logic. The recipe is fitted to the movement, never to the company and never to the story.
Catches the small, fast swings.
With a trend filter, waits for the large, slow ones.
Sits between.
Backtested results. Past performance does not guarantee future results. For educational purposes only.
“The four-swing slide”
Jul 1 to Nov 4, 2026 · 6-hour bars · Micro recipe
Four months, four swings, each 25% to 55%, inside a trend that cut the price in half. Buy and hold ended at $49,989 on $100,000. DCA, buying monthly, ended at $56,921. Both bought every leg down and sold none of the legs up.
The algorithm, on a micro recipe, bought the three dips and sold the three bounces. Its last sale came in late October. It holds no shares.
+24.1%
- Buy and hold −50%, outperformance +74.1 percentage points
- DCA −43.1%, outperformance +67.2 percentage points
- Ending value
- $124,106
- Realized profit, all in cash
- $24,106
- Shares held at close
- 0

Open full-size chart
- 1Aug 21 24/7 Wall St
"IREN Jumps 6% but Then Gives Up Gains as Microsoft Accepts Horizon 1"
Next two weeks: the stock kept falling.
- 2Aug 31 24/7 Wall St
"IREN Limited Keeps Falling: A Respected Ratings Agency Sees 185% Growth Anyway"
Next two weeks: a bounce of about 35% began.
- 3Sep 26 24/7 Wall St
JPMorgan upgrades to Overweight, $24 billion revenue by 2030
Next two weeks: the stock peaked near $47 and began a 55% fall.
- 4Oct 21 24/7 Wall St
"IREN Limited Crashed 40% This Month: Three Wall Street Analysts Agree It's Going to Quadruple"
Next two weeks: a new 52-week low.
Backtested results, 6-hour bars, Jul 1 to Nov 4, 2026. Past performance does not guarantee future results. For educational purposes only.
“Two dips, one rally, out before the fall”
Jul 20 to Nov 4, 2026 · 4-hour bars · Macro recipe, trend filter on
Two shallow dips, one 45% rally, then a 50% fall over five weeks. Buy and hold ended at $60,465. DCA ended at $66,625. Both were fully exposed to the fall.
The algorithm, on a macro recipe with the trend filter on, made two buys at the dips and one sale into the rally. It has held cash since early October.
+24.2%
- Buy and hold −39.5%, outperformance +63.7 percentage points
- DCA −33.4%, outperformance +57.5 percentage points
- Ending value
- $124,147
- Realized profit, all in cash
- $24,147
- Shares held at close
- 0
- Last sale
- Early October

Open full-size chart
- 1Sep 19 Motley Fool
CEO Lip-Bu Tan says Intel can support "about half" of server CPU demand
Next two weeks: the stock rallied toward $127.
- 2Oct 7 Motley Fool
"Why Intel Rallied in September", up 34.3% for the month
Next two weeks: the stock gave back most of the rally.
- 3Oct 29 Forbes
Q3 revenue $16.5 billion, EPS $0.52 against a $0.39 estimate, Q4 guidance $15 to $16 billion
Next day: down 28.6%, the worst day in a year.
Backtested results, 4-hour bars, Jul 20 to Nov 4, 2026. Past performance does not guarantee future results. For educational purposes only.
“Five months, nowhere, four swings”
Jun 10 to Nov 4, 2026 · Daily bars · Mid recipe
A stock that ended within 2% of where it started. Buy and hold made $2,086. DCA made $5,805. A holder who checked the price in June and again in November would call it a wasted summer.
The algorithm, on a mid recipe, bought the drop after Q2 and sold the recovery, then bought the September dip and sold the November climb. Two round trips in a flat stock.
+29.5%
- Buy and hold +2.1%, outperformance +27.4 percentage points
- DCA +5.8%, outperformance +23.7 percentage points
- Ending value
- $129,462
- Realized profit, all in cash
- $29,462
- Shares held at close
- 0
- Strategy against buy and hold
- +29.5% vs +2.1%

Open full-size chart
- 1Late July Motley Fool
Q2 report, deliveries recover, margins compress
Next two weeks: the stock bottomed near $300.
- 2Sep 3 Motley Fool
"Why Tesla Stock Surged 18% in August", with Nevada raising the robotaxi cap to 5,000 and the Cybercab launching in Austin
Next day: down 6% as the Cybercab update "underwhelms".
- 3Oct 21 Karmactive
Q3 deliveries fell 2% to 486,532
Next two weeks: the stock climbed toward $410.
Backtested results, daily bars, Jun 10 to Nov 4, 2026. Past performance does not guarantee future results. For educational purposes only.
Side by side
| IREN | INTC | TSLA | |
|---|---|---|---|
| Business | Bitcoin mining and AI data centers | Semiconductors | Electric vehicles |
| What the headlines said | Analysts called for a double, then a quadruple | A 34% September rally, then an earnings beat | An 18% August surge on robotaxis |
| What the stock did | −50% | −39.5% | +2.1% |
| Chart interval | 6-hour | 4-hour | Daily |
| Recipe | Scope 1, micro | Scope 7, macro, trend filter | Scope 5, mid |
| Strategy ROI | +24.1% | +24.2% | +29.5% |
| Ending value | $124,106 | $124,147 | $129,462 |
| Realized profit | $24,106 | $24,147 | $29,462 |
| Shares held at close | 0 | 0 | 0 |
| vs buy and hold | +74.1 pts | +63.7 pts | +27.4 pts |
| vs DCA | +67.2 pts | +57.5 pts | +23.7 pts |
Backtested results, valued Nov 4, 2026. Past performance does not guarantee future results. For educational purposes only.
Why the results are similar
A symbol study asks why three windows on one stock produce different results. This study asks the opposite. Three stocks with different businesses, different news and different directions landed in a five-point band.
They landed together because the algorithm answered the same question three times: has the price moved far enough from the band to act. IREN answered it on 6-hour bars with small swings. INTC answered it on 4-hour bars with two large ones. TSLA answered it daily with four medium ones. The question never changed. The headlines changed every week and the algorithm never saw one.
The honest caveat: the recipes differ, and that is the point. Scope 1 on INTC or scope 7 on IREN would not have produced these numbers. The recipe is fitted to the movement. The edge is not prediction, it is not the stock, and it is not the news.
Backtested results. Past performance does not guarantee future results. For educational purposes only.
The real lesson
- 01
Every stock swings
The one you love and the one you would never own both dropped 25% and bounced 30% this summer. The opinion decided what you held. The swing decided what you earned.
- 02
The headline is not the signal
The best news on each of these stocks ran inside a drop. The worst ran after the bounce. If you traded the news you were late three times out of three.
- 03
Choose the movement, let the recipe fit the symbol
The decision that mattered was not IREN versus INTC versus TSLA. It was micro versus macro, and that decision has a rule.
The client decision is the same one as always: what job do you want the algorithm doing. In this series the job is collecting swings in stocks you would otherwise sit through, with the news on in the background.
Backtested results. Past performance does not guarantee future results. For educational purposes only.
A path forward
Arch Public connects to your brokerage. You keep custody. You choose the recipe. The algorithm executes the rules, and you stop trading your opinion and start trading the movement.
In three stocks this summer, buy and hold lost half, lost 40% and made 2%. The algorithm made +24% to +29% and finished each in cash, without reading a headline.
Which one do you want running next summer?
Buy and hold, TSLA
+2.1%
The algorithm, TSLA
+29.5%
$29,462 realized, all in cash
A miner, a chipmaker and a carmaker. One got upgrades on the way down, one beat earnings and lost a quarter of its value the next day, one surged on a story and fell on the launch. The algorithm returned between +24.1% and +29.5% on all three and ended each one in cash. What the three had in common was not their news. It was that they moved.