
NVDA: turning a year of crises into profit, over +20% three ways
Three Market Wave Algorithm for Equities strategies kept over 20% on NVDA in 2026, while buy and hold gave back every 2026 gain.
November 2026. Up 26.7% for the year in October, down 8.0% by Nov 11. It was avoidable.
Why this series, and why now
Every AI thesis runs through one stock. If you believe in the buildout, you own NVDA. If you doubt it, you watch it. Either way the opinion decides what you hold. It does not decide what you earn. In 2026 NVDA did a great deal: it rallied 42.7% from its March low to a record, and on Oct 6 it was up 26.7% for the year. Five weeks later it had given all of it back, down 8.0% by Nov 11.
A holder lived through every leg and kept none of it. That was avoidable. This study runs the same stock through three chart intervals, from hourly bars to daily bars, and shows how a rules-based algorithm kept what a holder gave back.
Six exits, the last at the October high
Strategy+21.8%
- Buy and hold
- −8.8%
- DCA
- −12.9%
Bought the low, twice
Strategy+25.5%
- Buy and hold
- −8.0%
- DCA
- −12.9%
Scale out, step aside
Strategy+28.5%
- Buy and hold
- −8.2%
- DCA
- −13.3%
All three from the same hypothetical $100,000 in cash and zero shares.
Backtested results. Past performance does not guarantee future results. For educational purposes only.
The movement
The movement in this study is the round trip. NVDA closed Jan 2 at $188.85, reached a record $239.24 on Oct 6, up 26.7% for the year, and closed Nov 11 at $173.73, down 8.0%. On the way it fell 15.5%, rose 42.7%, fell 19.4%, rose 25.9% and fell 29.4%.
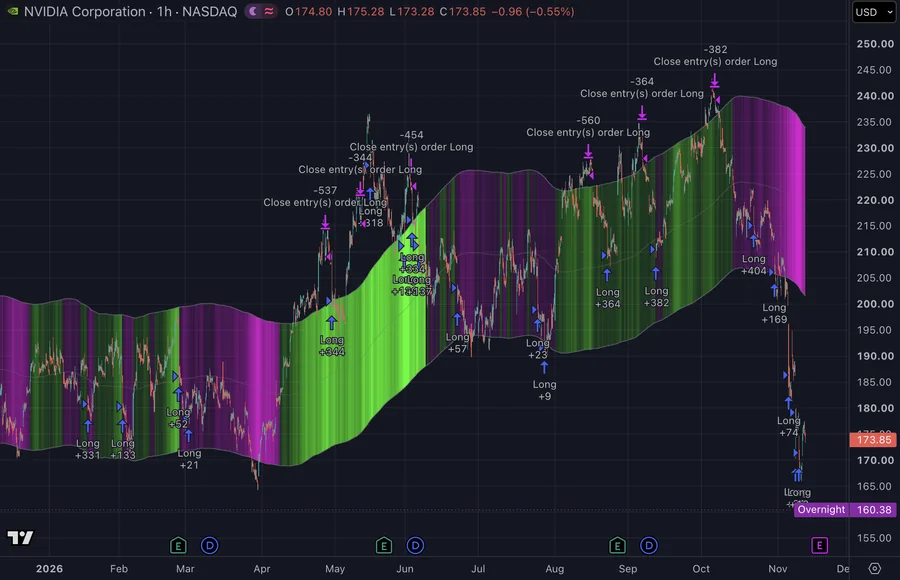
1-hour The fine lens. Each of the five legs breaks into smaller swings, and the hourly strategy trades inside the legs as well as across them.
- 1Feb 26 "Nvidia's blowout earnings report disappoints Wall Street as stock sinks 5%" CNBC
- 2May 21 "Nvidia's latest record earnings fail to impress investors" BBC
- 3Oct 5 "Up 28% in 2026, NVIDIA Just Tapped an All-Time High: Is the Rally Overextended or Just Getting Started?" 24/7 Wall St
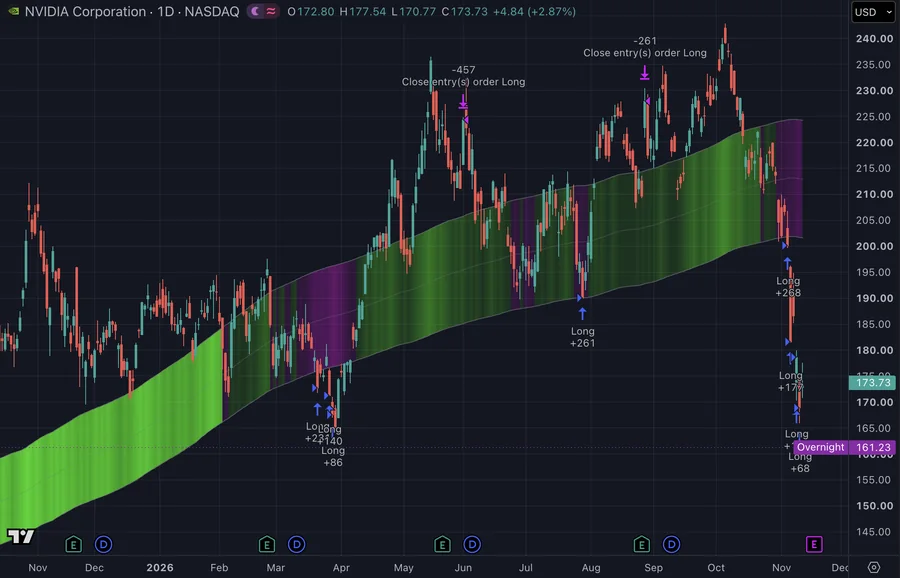
Daily The slow lens. One bar a day, and only the deepest dips reach below the band: late March, late July and the November fall.
- 1Mar 16 "Stock Market Today, March 16: Nvidia Rises After GTC 2026 Unveils New Blackwell and Vera Rubin AI Architectures" Motley Fool
- 2Jul 27 "Nvidia drops nearly 5%, leading chip stocks lower amid renewed worries of circular financing" Yahoo Finance
- 3Aug 26 "Nvidia forecasts 70% sales growth next year, signals AI spending boom has years left to run" Reuters
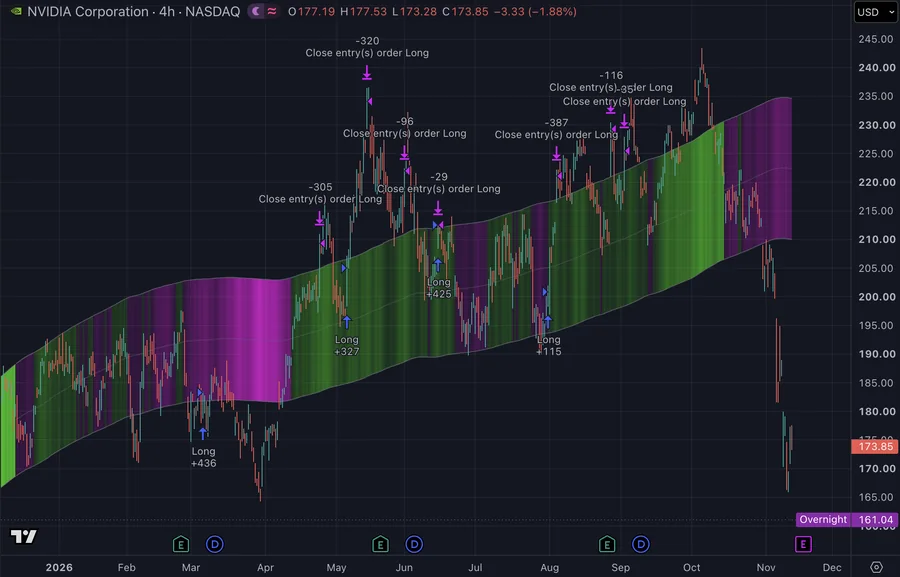
4-hour The middle lens. Two bars a day, enough to catch each leg's turn: lows in early March, early May and late July, highs in April, May and August.
- 1May 6 "Nvidia is facing more competition and it's spooking investors" Bloomberg
- 2May 14 "NVIDIA is Up 20% in a Month. Could the May 20 Earnings Report Knock It Right Back Down?" 24/7 Wall St
- 3Nov 5 Tech sell-off wipes $2.5 trillion from the stock market CNN
Here is the catch that matters for this study: the GTC launch on Mar 16 ran two weeks before the year's low. The record on Oct 5 ran a day before a 29.4% fall began. The gloomiest headlines, May 6 and Jul 27, ran within two days of a low.
The opinion trap
The thesis anchor
You believe AI runs on Nvidia's chips, so you hold through every drop. On Mar 16 the GTC keynote unveiled Vera Rubin. Two weeks later NVDA closed at $165.17, its low of the year.
The headline reflex
The news feels like a signal because it arrives with a date and a number. Nvidia beat estimates on Feb 25 and fell 5.5% the next day. It reported record earnings on May 20 and fell 6.6% over the two weeks after the BBC headline.
The wrong question
Is Nvidia the best company in AI is a question you answer once. How is it moving is a question the price answers every hour. On Oct 6 NVDA was up 26.7% for the year. Five weeks later it was down 8.0%.
Dollar-cost averaging deserves credit. It removes the timing decision and keeps you buying through the fear. Its cost is structural: it bought every month at whatever the price was, sold nothing at $235.74 in May or $239.24 in October, and ended down 12.9% to 13.3%.
A rules-based algorithm restores the second question. It does not read the news. It reads the price.
The algorithm
Ride confirmed moves
The Market Wave band defines the current trend. Entries come below it, exits above it, only after a move of a set size.
Exit on rules, not nerves
Every exit is a threshold crossed, never a reaction to a headline.
Step aside in chop
When no move clears the threshold, the algorithm holds cash and waits.
The algorithm reads price, never news. The chart interval sets how often it looks; the scope sets how big a swing counts. Hourly bars at scope 18 see swings inside each leg. Daily bars at scope 10, buying only below the band, wait for the deep dips. 4-hour bars at scope 15 sell 70% at each exit and keep the rest working.
Sees swings inside each leg.
Buying only below the band, waits for the deep dips.
Sells 70% at each exit and keeps the rest working.
Backtested results. Past performance does not guarantee future results. For educational purposes only.
“Six exits, the last at the October high”
Jan 1 to Nov 11, 2026 · 1-hour bars · Macro strategy
Ten months of NVDA on hourly bars: five legs of 15.5% to 42.7%, and a year down 8.8% from the first hourly close. Buy and hold ended at $91,222 on $100,000. DCA, buying monthly, ended at $87,104. Both sat through every leg.
The algorithm, on a macro strategy, bought four times from January to early March and sold everything in late April. It then sold five more times into highs: mid-May, early June, mid-August, early September and early October. From late October it bought back into the fall.
+21.8%
- Buy and hold −8.8%, outperformance +30.6 percentage points
- DCA −12.9%, outperformance +34.7 percentage points
- Ending value
- $121,823
- Realized profit, the most of the three strategies
- $45,006
- Shares held at close
- 691

Open full-size chart
- 1Feb 26 CNBC
"Nvidia's blowout earnings report disappoints Wall Street as stock sinks 5%"
Next day: down another 4.2%.
- 2May 21 BBC
"Nvidia's latest record earnings fail to impress investors"
Next two weeks: down 6.6%.
- 3Oct 5 24/7 Wall St
"Up 28% in 2026, NVIDIA Just Tapped an All-Time High: Is the Rally Overextended or Just Getting Started?"
Next two weeks: down 9.1%, the start of a 29.4% fall.
Backtested results, 1-hour bars, Jan 1 to Nov 11, 2026. Past performance does not guarantee future results. For educational purposes only.
“Bought the low, twice”
Jan 1 to Nov 11, 2026 · Daily bars · Mid strategy
The same ten months on daily bars. Buy and hold, from the Jan 2 close of $188.85, ended at $91,994 on $100,000. DCA ended at $87,142. The daily strategy acted only when the price fell below the band, and that happened three times.
The algorithm, on a mid strategy, bought 40% slices on Mar 20, Mar 26 and Mar 27, between $167.52 and $172.70, and sold all of them on Jun 1 at $224.36. It bought again on Jul 29 at $190.01 and sold on Aug 27 at $227.98. It sat in cash through the October record, then bought four slices in the November fall.
+25.5%
- Buy and hold −8.0%, outperformance +33.5 percentage points
- DCA −12.9%, outperformance +38.4 percentage points
- Ending value
- $125,496
- Realized profit
- $34,169
- Shares and cash at close
- 621 shares, $17,610 cash
- Last March buy
- $167.52

Open full-size chart
- 1Mar 16 Motley Fool
"Stock Market Today, March 16: Nvidia Rises After GTC 2026 Unveils New Blackwell and Vera Rubin AI Architectures"
Next two weeks: down 9.9%, to the year's low.
- 2Jul 27 Yahoo Finance
"Nvidia drops nearly 5%, leading chip stocks lower amid renewed worries of circular financing"
Next two weeks: up 10.7%, after one more low.
- 3Aug 26 Reuters
"Nvidia forecasts 70% sales growth next year, signals AI spending boom has years left to run"
Next day: up 8.7%, then down 4.3% over two weeks.
Backtested results, daily bars, Jan 1 to Nov 11, 2026. Past performance does not guarantee future results. For educational purposes only.
“Scale out, step aside”
Jan 1 to Nov 11, 2026 · 4-hour bars · Macro strategy with trend filter
The same ten months on 4-hour bars. Buy and hold ended at $91,809 on $100,000. DCA ended at $86,734, the weakest of the three benchmarks. Both rode the final 29.4% fall fully invested, into a week of headlines about the CEO's future.
The algorithm, on a macro strategy with the trend filter on, bought in early March and sold 70% in late April. It bought the May 5 low and sold 70% at the May 14 high. It kept selling 70% into each high, in June, August and early September, and bought back in June and late July. From early September it held 15 shares.
+28.5%
- Buy and hold −8.2%, outperformance +36.7 percentage points
- DCA −13.3%, outperformance +41.7 percentage points
- Ending value
- $128,481
- Realized profit
- $28,886
- Shares held at close
- 15
- Cash at close, 98% of the portfolio
- $125,874

Open full-size chart
- 1May 6 Bloomberg
"Nvidia is facing more competition and it's spooking investors"
Next two weeks: up 7.5%, with a record close on May 14.
- 2May 14 24/7 Wall St
"NVIDIA is Up 20% in a Month. Could the May 20 Earnings Report Knock It Right Back Down?"
Next two weeks: down 10.4%.
- 3Nov 5 CNN
Tech sell-off wipes $2.5 trillion from the stock market
Next three trading days: down another 7.0%.
Backtested results, 4-hour bars, Jan 1 to Nov 11, 2026. Past performance does not guarantee future results. For educational purposes only.
Side by side
| 1-hour | Daily | 4-hour | |
|---|---|---|---|
| What the chart sees | Swings inside each leg | Only the deepest dips | Each leg's turn |
| What the headlines said | Record earnings, then an all-time high | A product launch, a selloff, a 70% growth forecast | More competition, up 20% in a month, a $2.5 trillion selloff |
| What the stock did | −8.8% | −8.0% | −8.2% |
| Chart interval | 1-hour | Daily | 4-hour |
| Strategy | Scope 18, macro, sells on a down-trend break | Scope 10, mid, buys only below the band | Scope 15, macro, trend filter, sells 70% at each exit |
| Strategy ROI | +21.8% | +25.5% | +28.5% |
| Ending value | $121,823 | $125,496 | $128,481 |
| Realized profit | $45,006 | $34,169 | $28,886 |
| Shares held at close | 691 | 621 | 15 |
| Cash at close | $1,692 | $17,610 | $125,874 |
| vs buy and hold | +30.6 pts | +33.5 pts | +36.7 pts |
| vs DCA | +34.7 pts | +38.4 pts | +41.7 pts |
Backtested results. Past performance does not guarantee future results. For educational purposes only.
Why the results are similar
Three intervals saw three different charts of the same stock and landed within 6.7 percentage points of each other. They landed together because the algorithm asked the same question on every bar: has the price moved far enough from the band to act. The hourly strategy answered it often. The daily strategy answered it three times. The 4-hour strategy answered it at each turn and kept a 30% remainder working.
The honest caveat: the strategies differ, and each was set for its interval. Scope 18 on daily bars or scope 10 on hourly bars would not have produced these numbers. The edge is not prediction, it is not the stock, and it is not the news.
Backtested results. Past performance does not guarantee future results. For educational purposes only.
The real lesson
- 01
Every stock swings, even the linchpin
The stock the whole AI trade leans on rose 42.7% to a record, then fell 29.4% and gave back the year. Believing in it decided what you held. The swings decided what you kept.
- 02
The headline is not the signal
Record earnings came before a drop. A record high came a day before a 29.4% fall. The gloomiest headlines ran within two days of a low.
- 03
Choose the lens, let the strategy fit it
The decision that mattered was not whether to own NVDA. It was how closely to watch it, and that decision has a rule.
The client decision is the same one as always: what job do you want the algorithm doing. Here the job is keeping the gains a holder gives back, in a stock you would otherwise sit through, with the news on in the background.
Backtested results. Past performance does not guarantee future results. For educational purposes only.
A path forward
Arch Public connects to your brokerage. You keep custody. You choose the strategy and the chart interval. The algorithm executes the rules, and you stop trading your opinion of the AI trade and start trading the movement.
In 2026, buy and hold on NVDA was up 26.7% on Oct 6 and down 8.0% to 8.8% by Nov 11. Three strategies kept over 20%, from +21.8% to +28.5%, without reading a headline.
Which strategy do you want taking profits on the next swing?
Buy and hold, NVDA 4-hour
−8.2%
The algorithm, NVDA 4-hour
+28.5%
$28,886 realized
One stock, one year, three ways of looking at it. The hourly strategy sold the most and bought back early. The daily strategy bought the two lows and is buying again. The 4-hour strategy sold 70% at each high and was almost all cash for the fall. Buy and hold gave back every 2026 gain. All three strategies kept between +21.8% and +28.5%.