
Rising marketNVDAStocksAccumulation
Catching Nvidia early in the trend
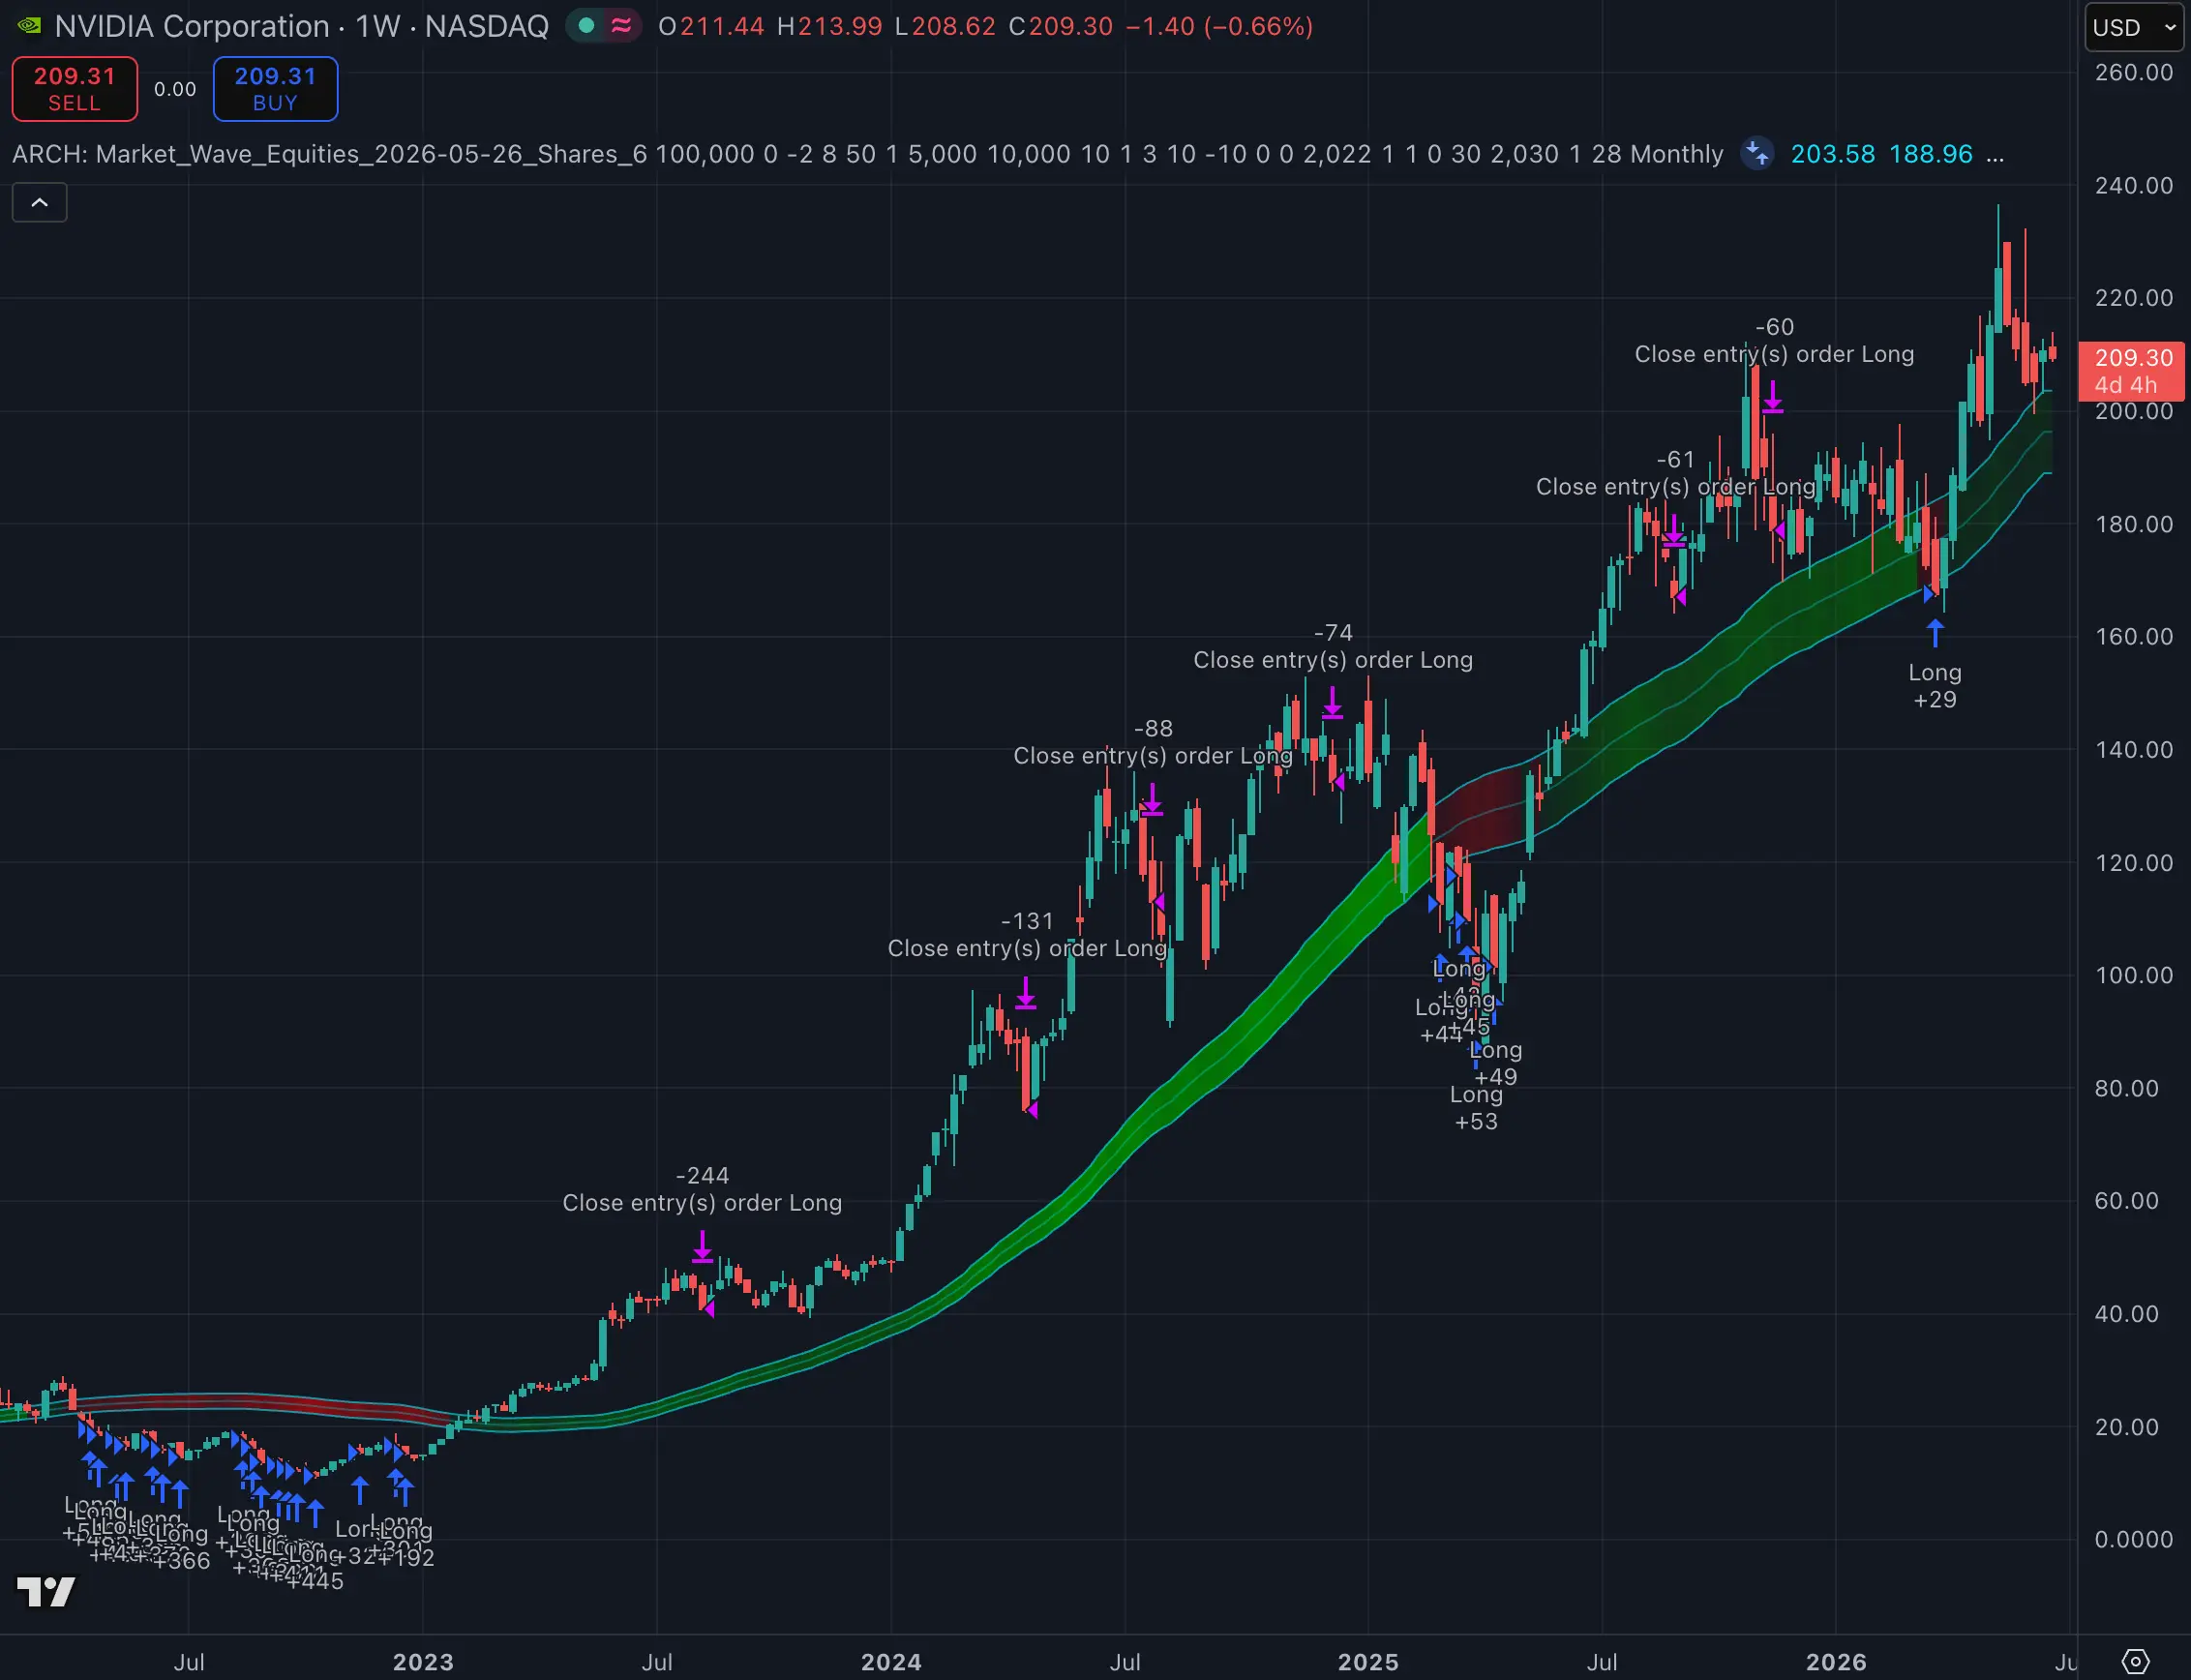
Strategy #41 · Market Wave · 1 Week chart
Strategy+1,192.4%
Buy and hold NVDA+668.0%
Backtested · 1 Jan 2022 – 22 Jun 2026
From the case study: Rules beat hesitation on NVDA
Strategy #99 · NVDA · Daily chart · Market Wave
A strategy for buying Nvidia during sharp falls and selling the full position on recovery.
Backtested As of 11 Nov 2026 · 1 Jan 2026 – 11 Nov 2026 · $100,000 starting capital
Strategy return
+25.5%
Buy and hold NVDA
−8.0%
Buying NVDA monthly
−12.9%
Test length
10 months
CAGR not shown under a year
Every trade from the backtest, straight from TradingView.
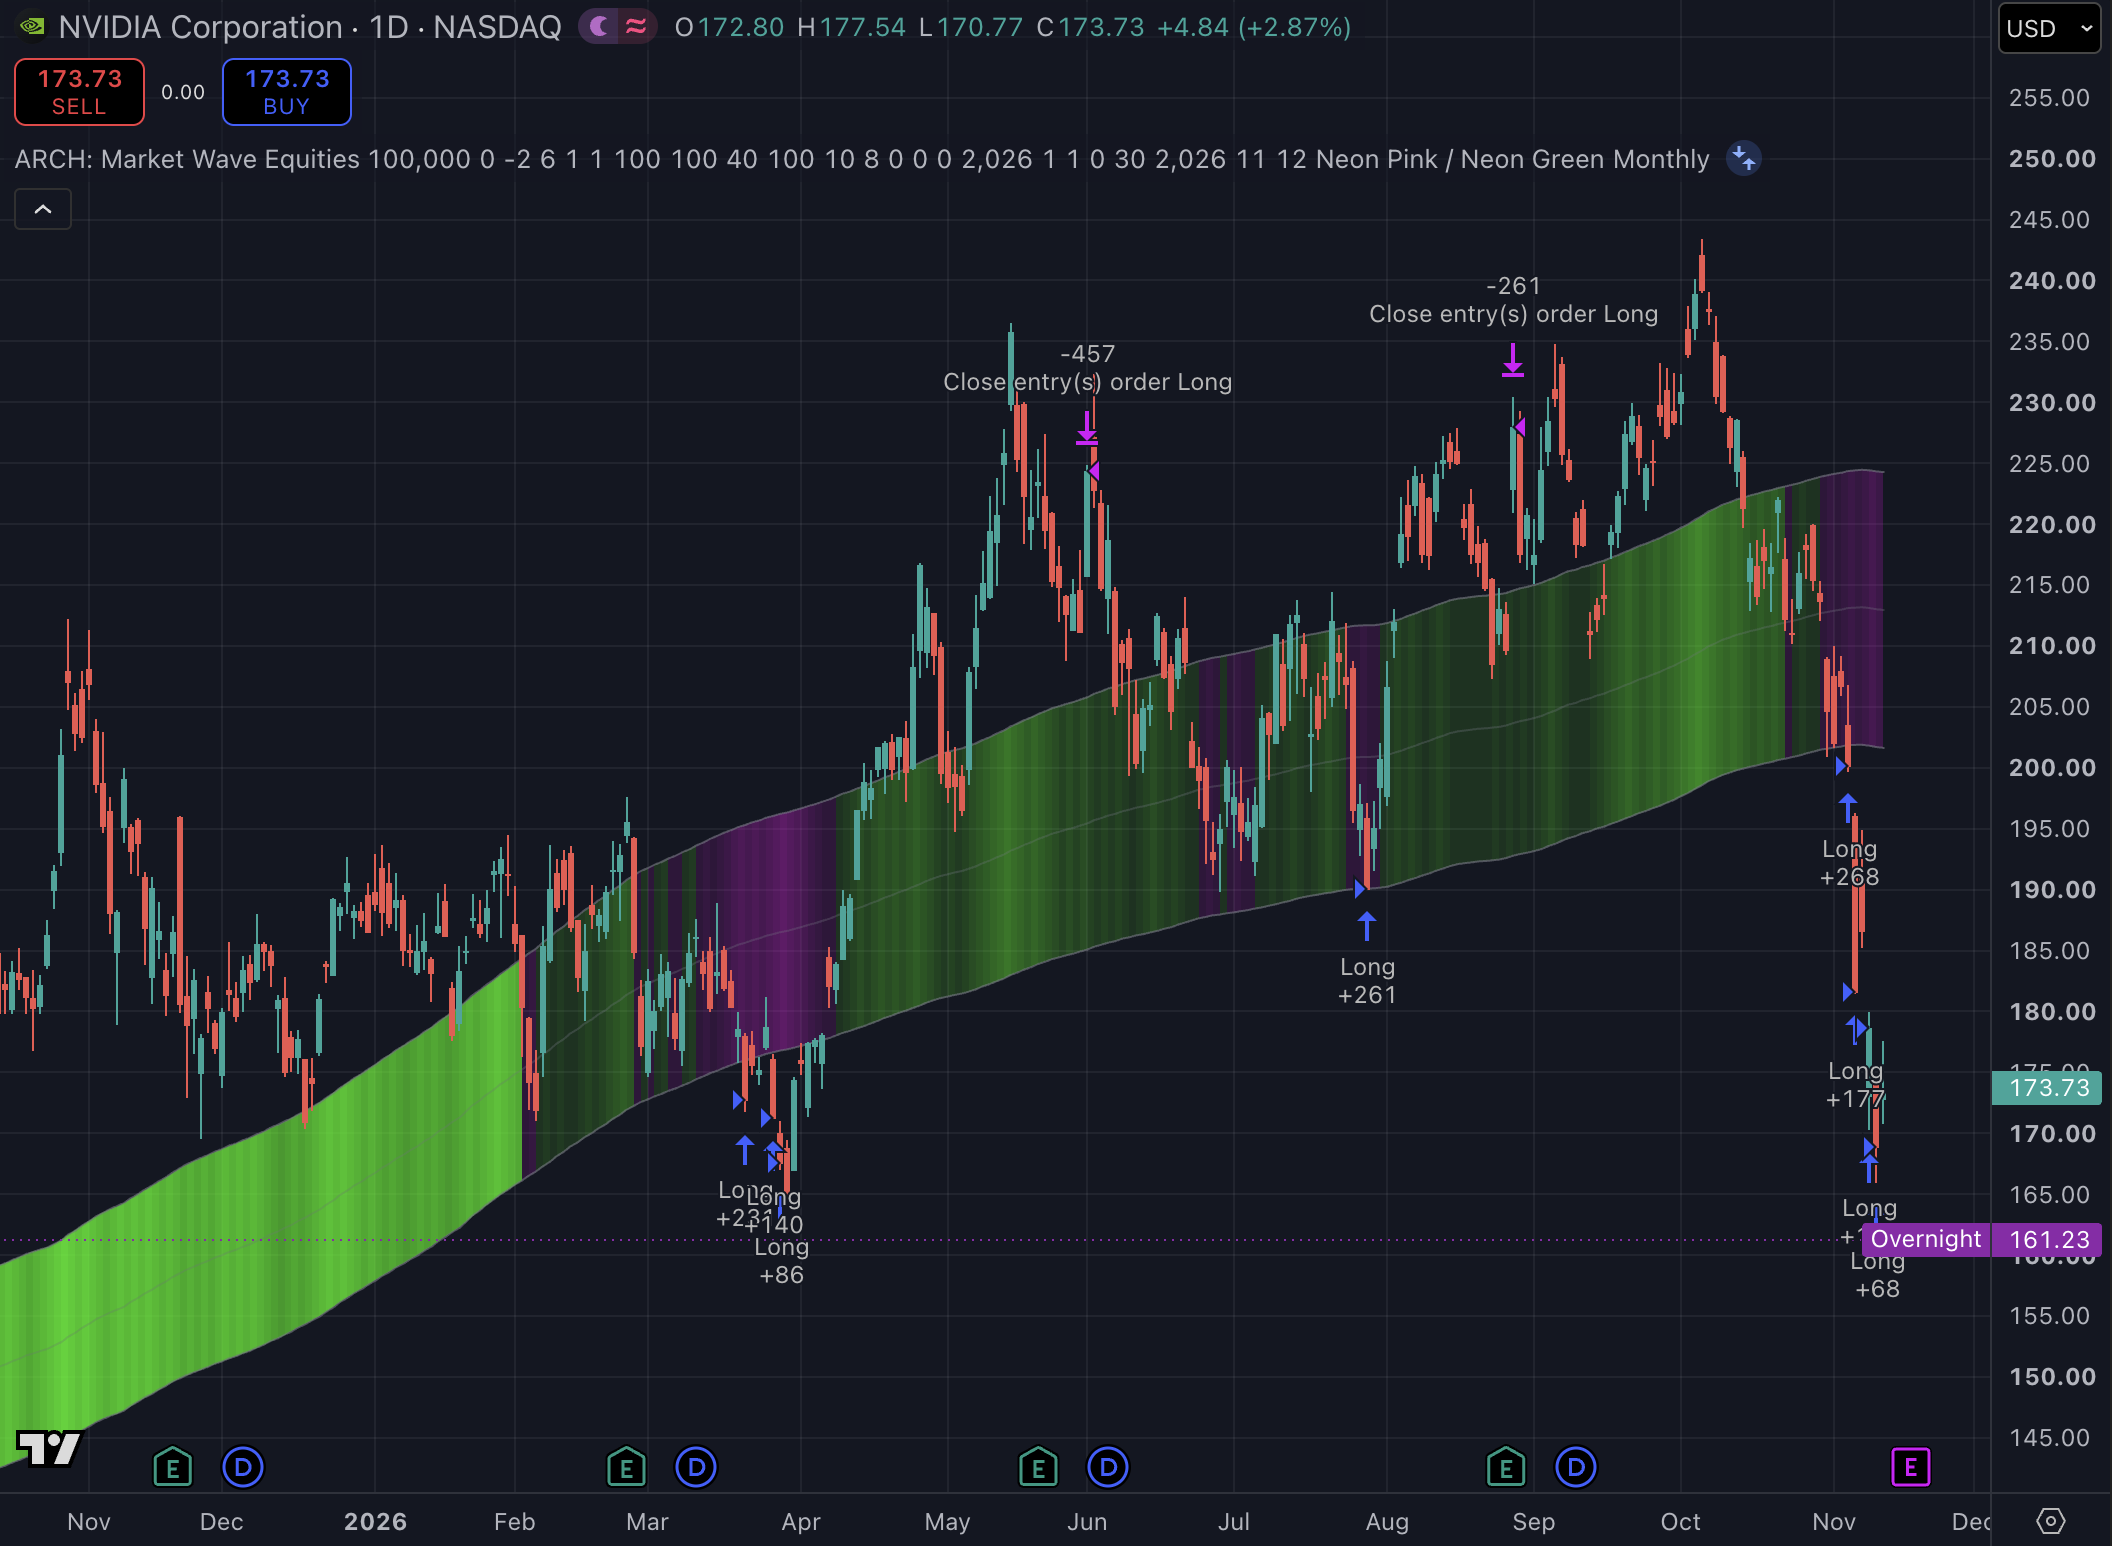
Total return over the test period, backtested.
Past and backtested performance does not guarantee future results.
Net profit
+$25,496
Ending value
$125,496
Cash profit
+$34,169
Asset accumulated
621 NVDA
From the case study
Strategy #99, Bought Nvidia at the low, twice, is the scenario “Bought the low, twice”. Read how it played out, chart by chart.
Read the case study →The case study is dated; the results above are this strategy's published version.
Buys a partial position when Nvidia falls below its price band, but only when the price is below its average cost. Sells the entire position in one trade, only when the price is above its average cost. Between signals it holds cash, waiting for the next dip below the band.
Exact settings come with every client account, the free tier included, in Strategy Lab Pro.
Start freeStrategy #41 · Market Wave · 1 Week chart
Backtested · 1 Jan 2022 – 22 Jun 2026
From the case study: Rules beat hesitation on NVDA
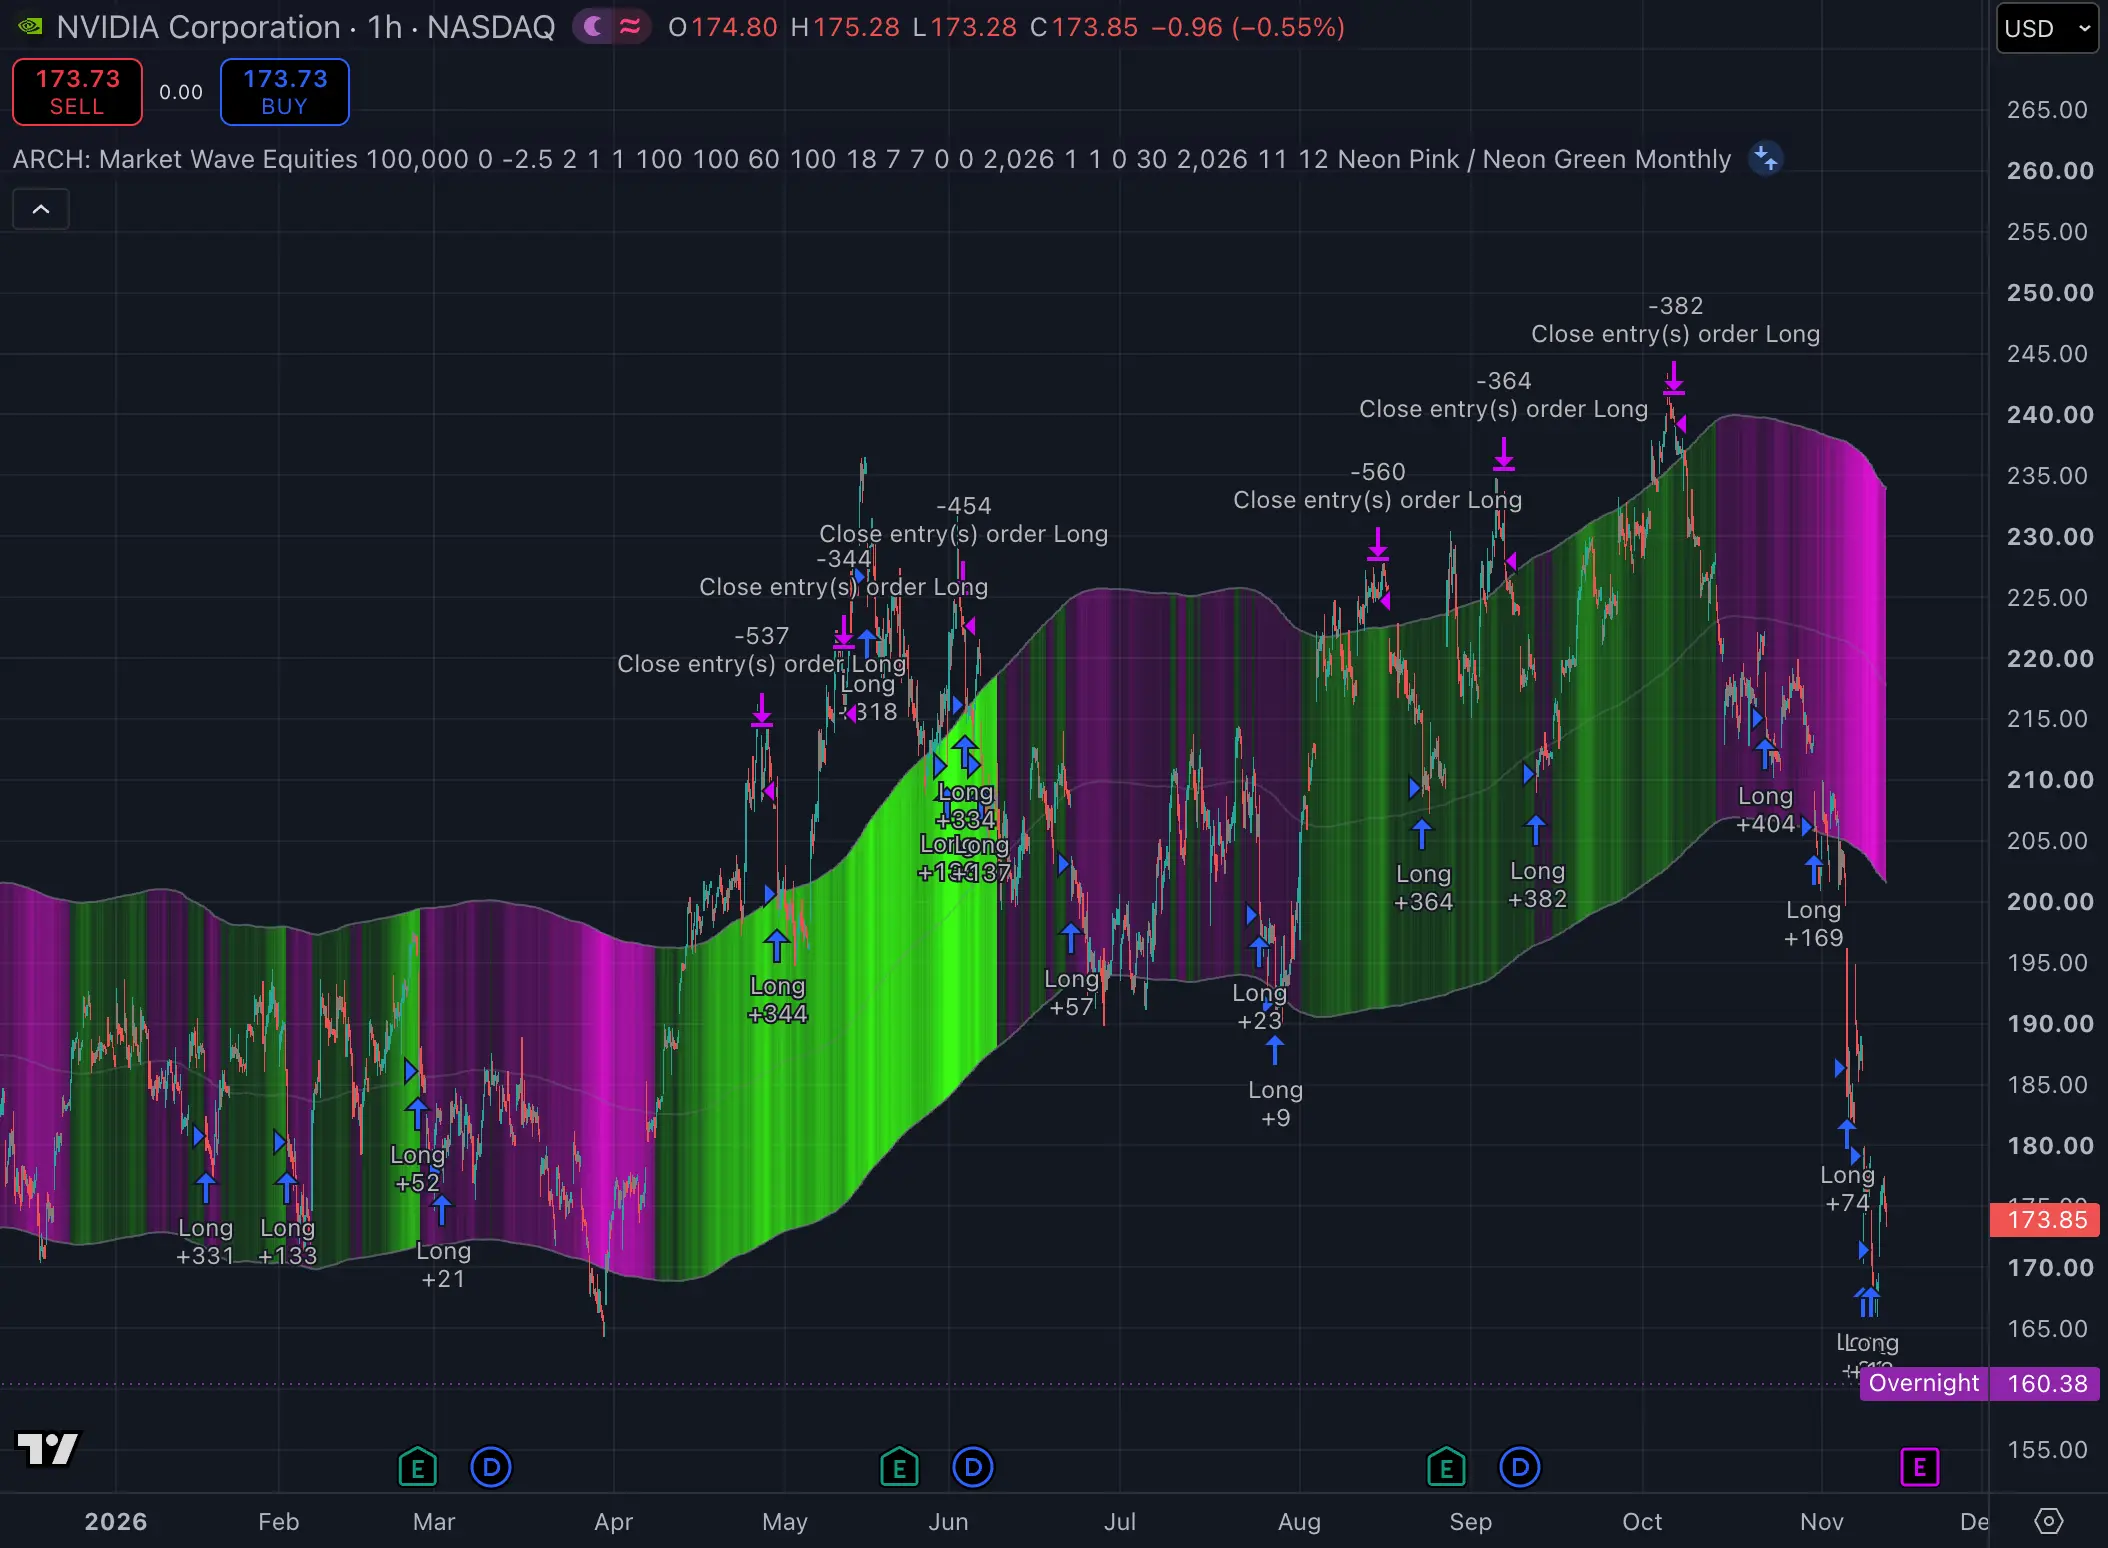
Strategy #101 · Market Wave · 1 Hour chart
Backtested · 1 Jan 2026 – 11 Nov 2026
From the case study: NVDA: turning a year of crises into profit, over +20% three ways
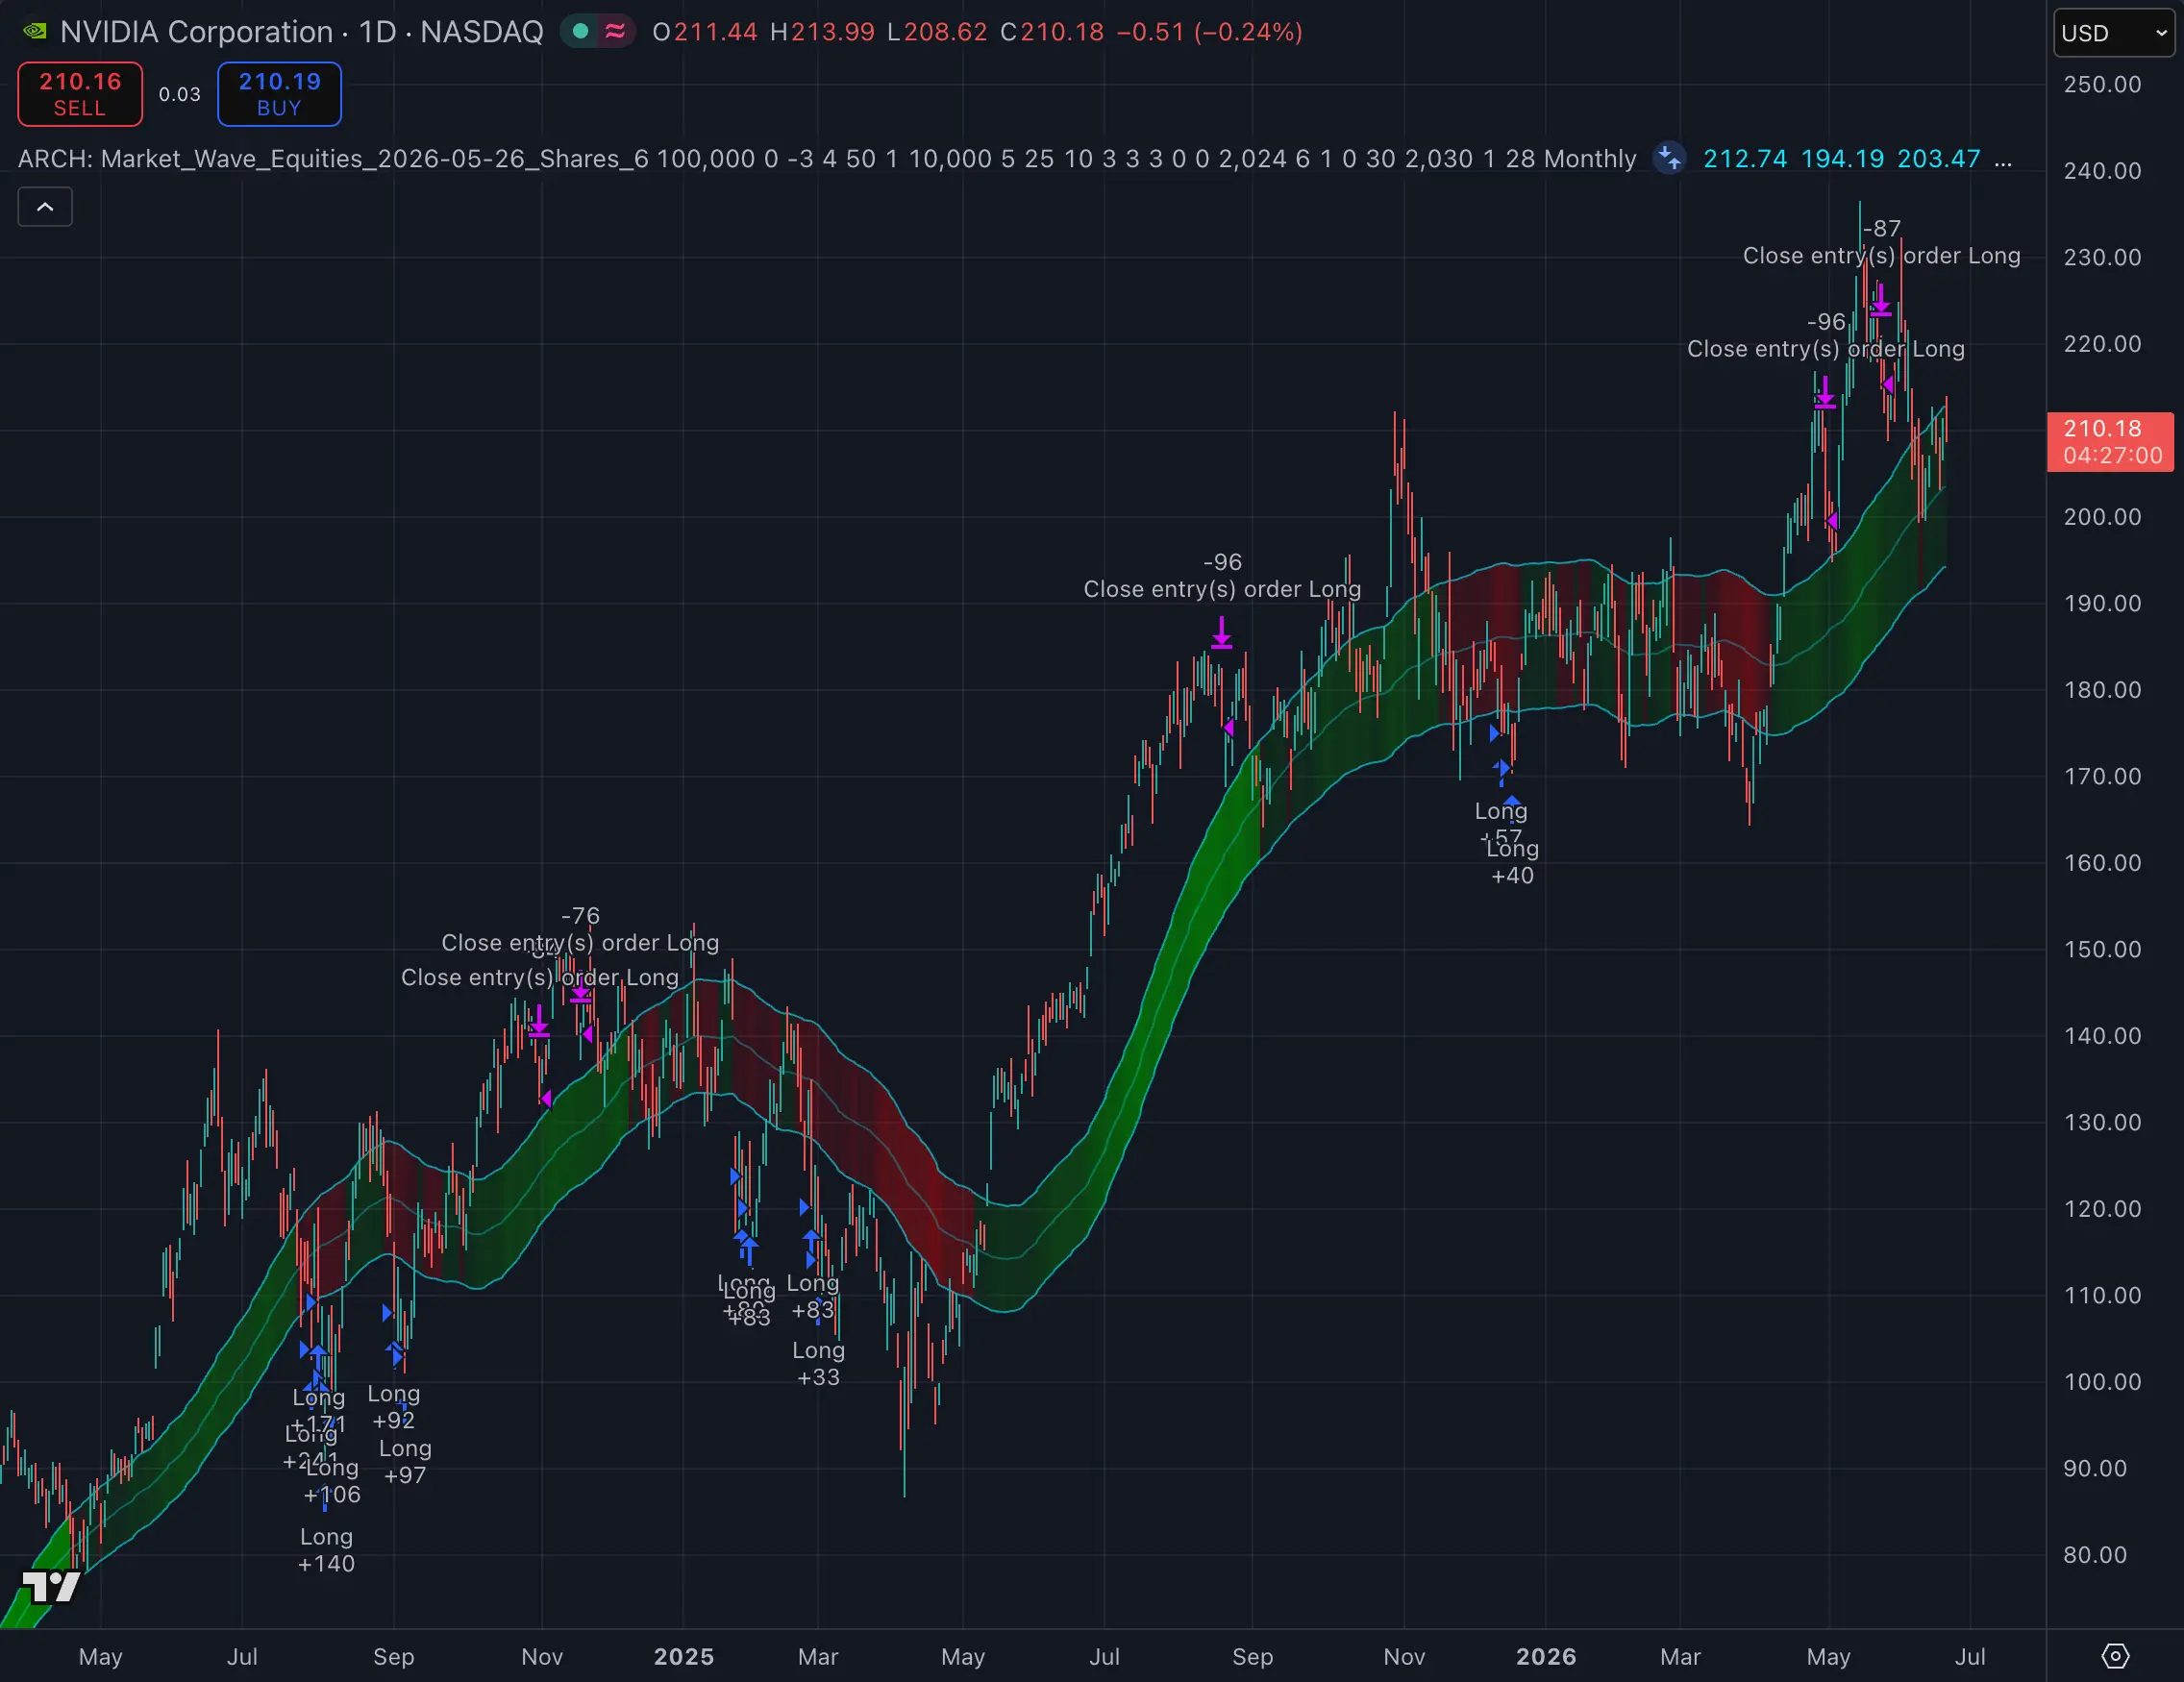
Strategy #50 · Market Wave · 1 Day chart
Backtested · 1 Jun 2024 – 1 Jun 2026
From the case study: Rules beat hesitation on NVDA