
IRENStocksBalance
Working harder through the IREN crash
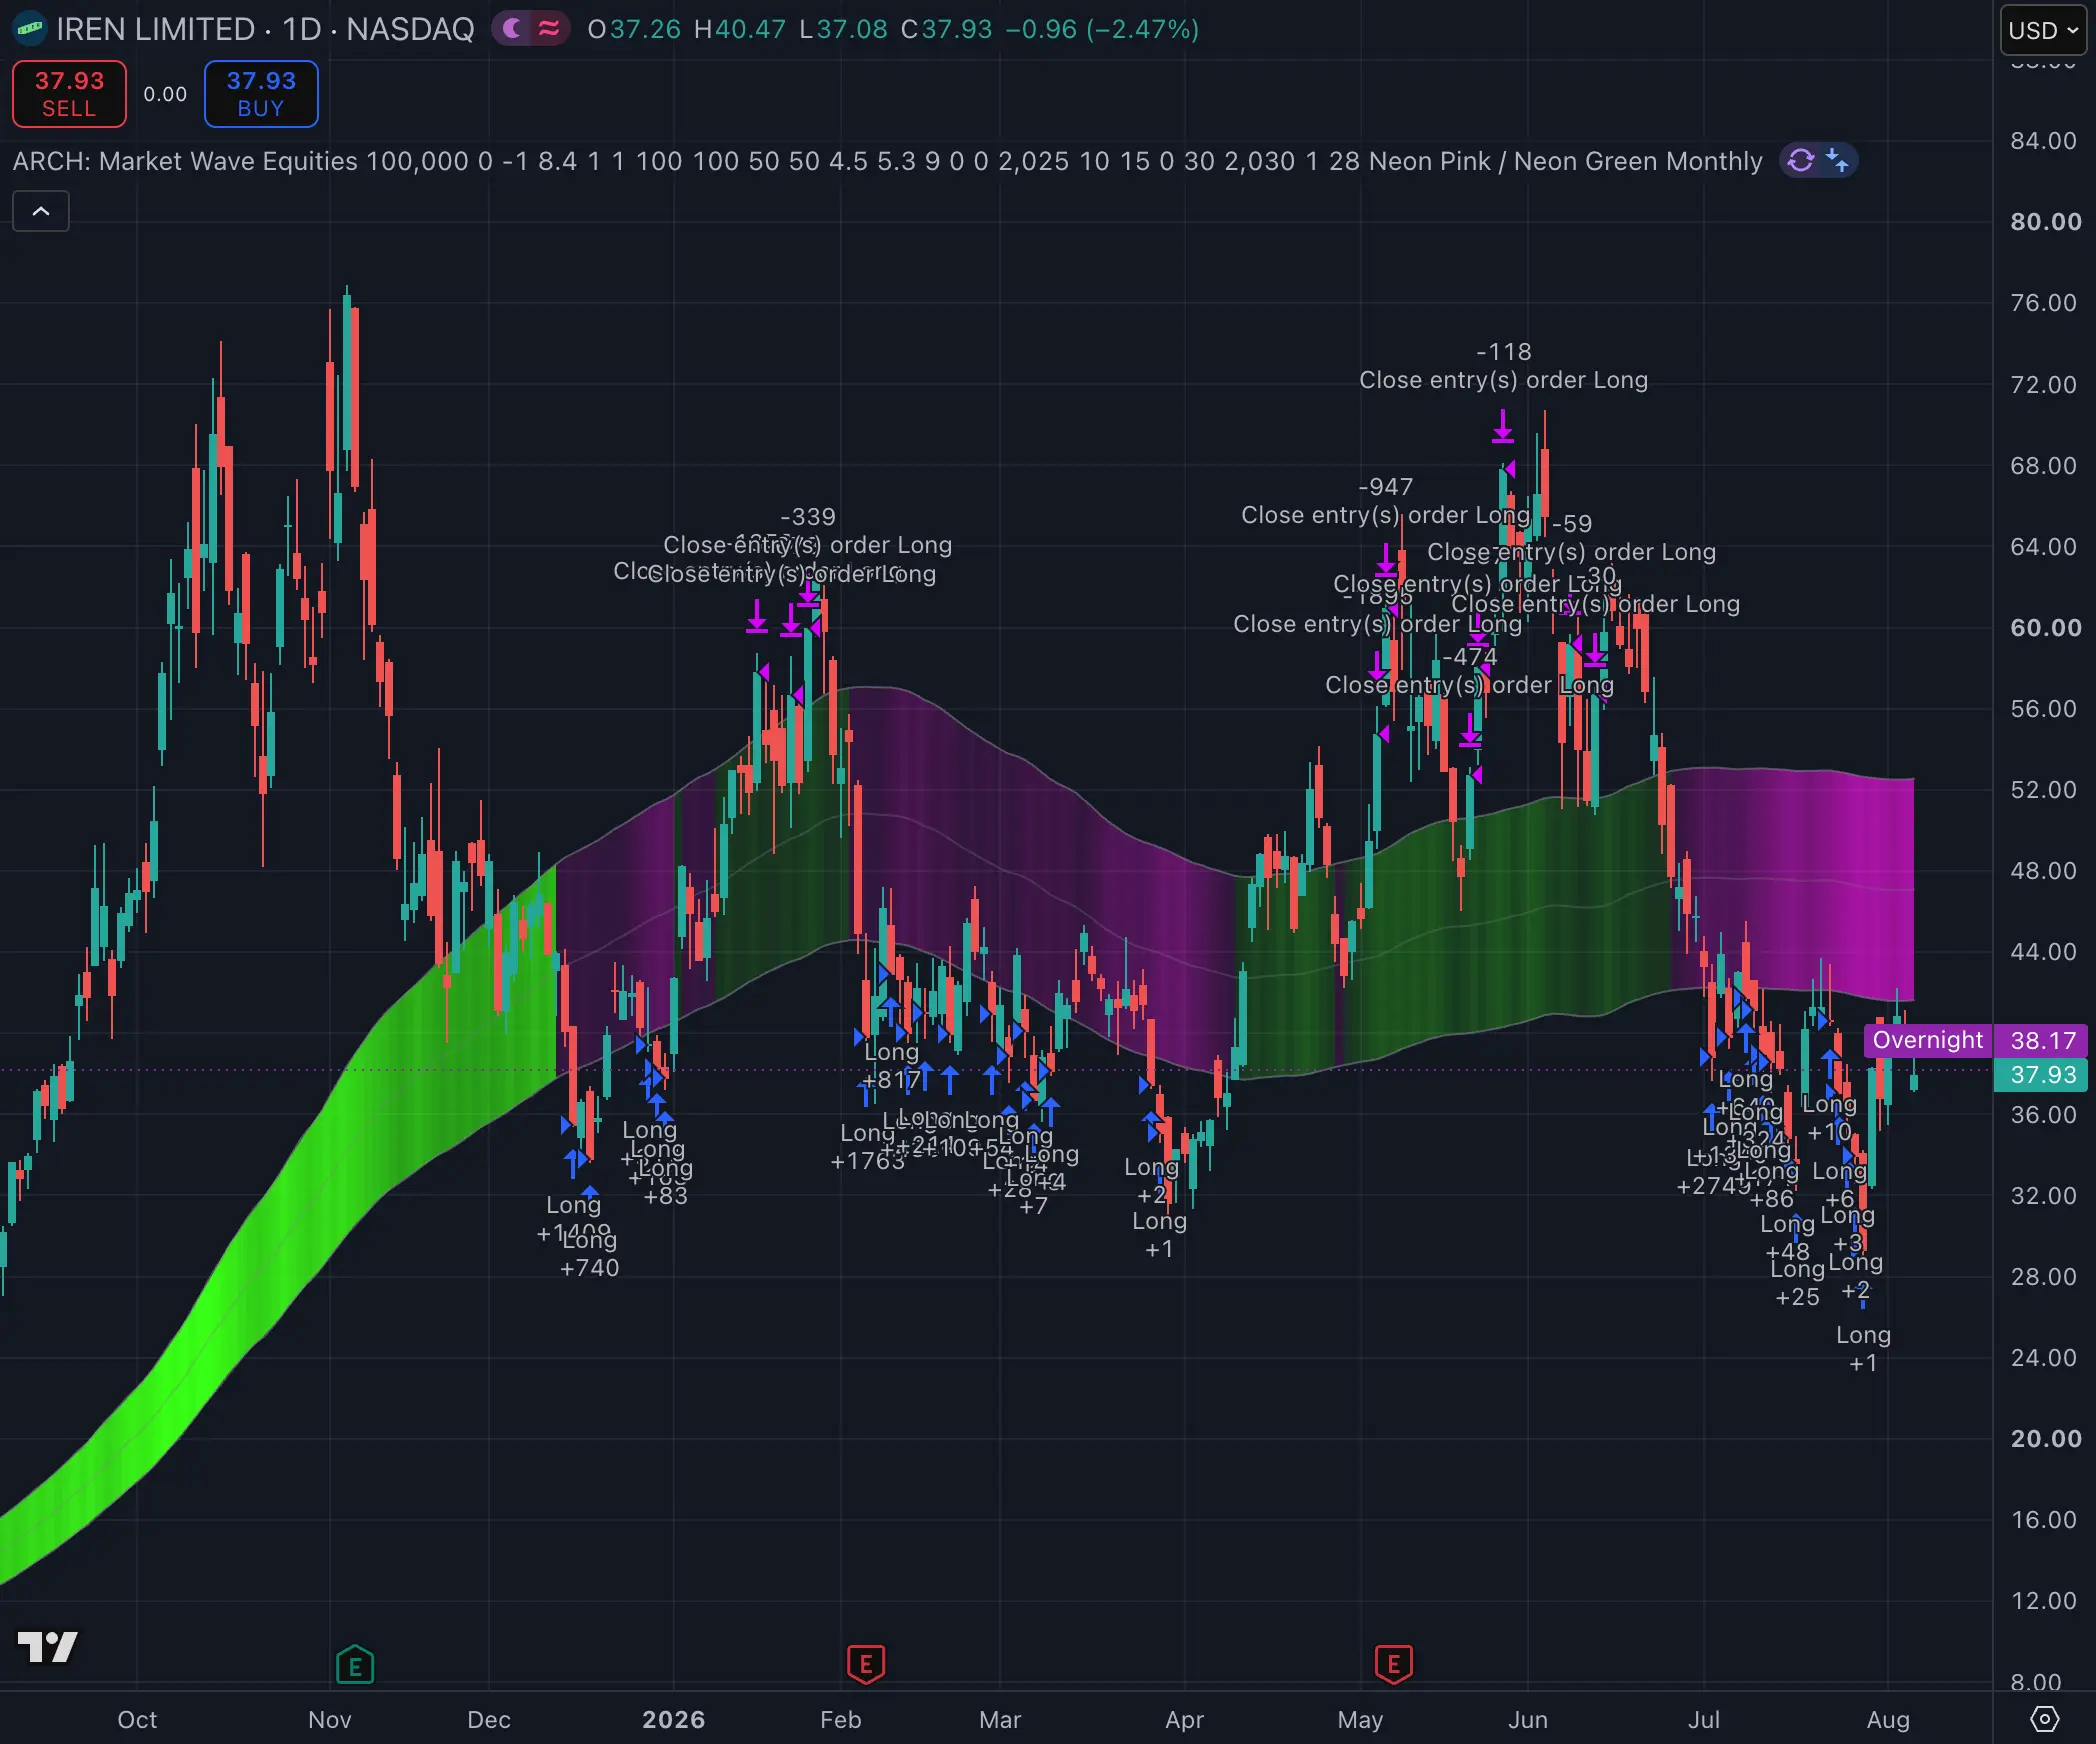
Strategy #61 · Market Wave · 1 Day chart
Strategy+106.2%
Buy and hold IREN−44.2%
Backtested · 15 Oct 2025 – 6 Aug 2026
From the case study: Riding the AI wave in a stock that got cut in half
Strategy #109 · IREN · 6-hour chart · Market Wave
Trades each swing in IREN's falling trend, buying dips and selling bounces back to cash.
Backtested As of 4 Nov 2026 · 1 Jul 2026 – 4 Nov 2026 · $100,000 starting capital
Strategy return
+24.1%
Buy and hold IREN
−50.0%
Buying IREN monthly
−43.1%
Test length
4 months
CAGR not shown under a year
Every trade from the backtest, straight from TradingView.
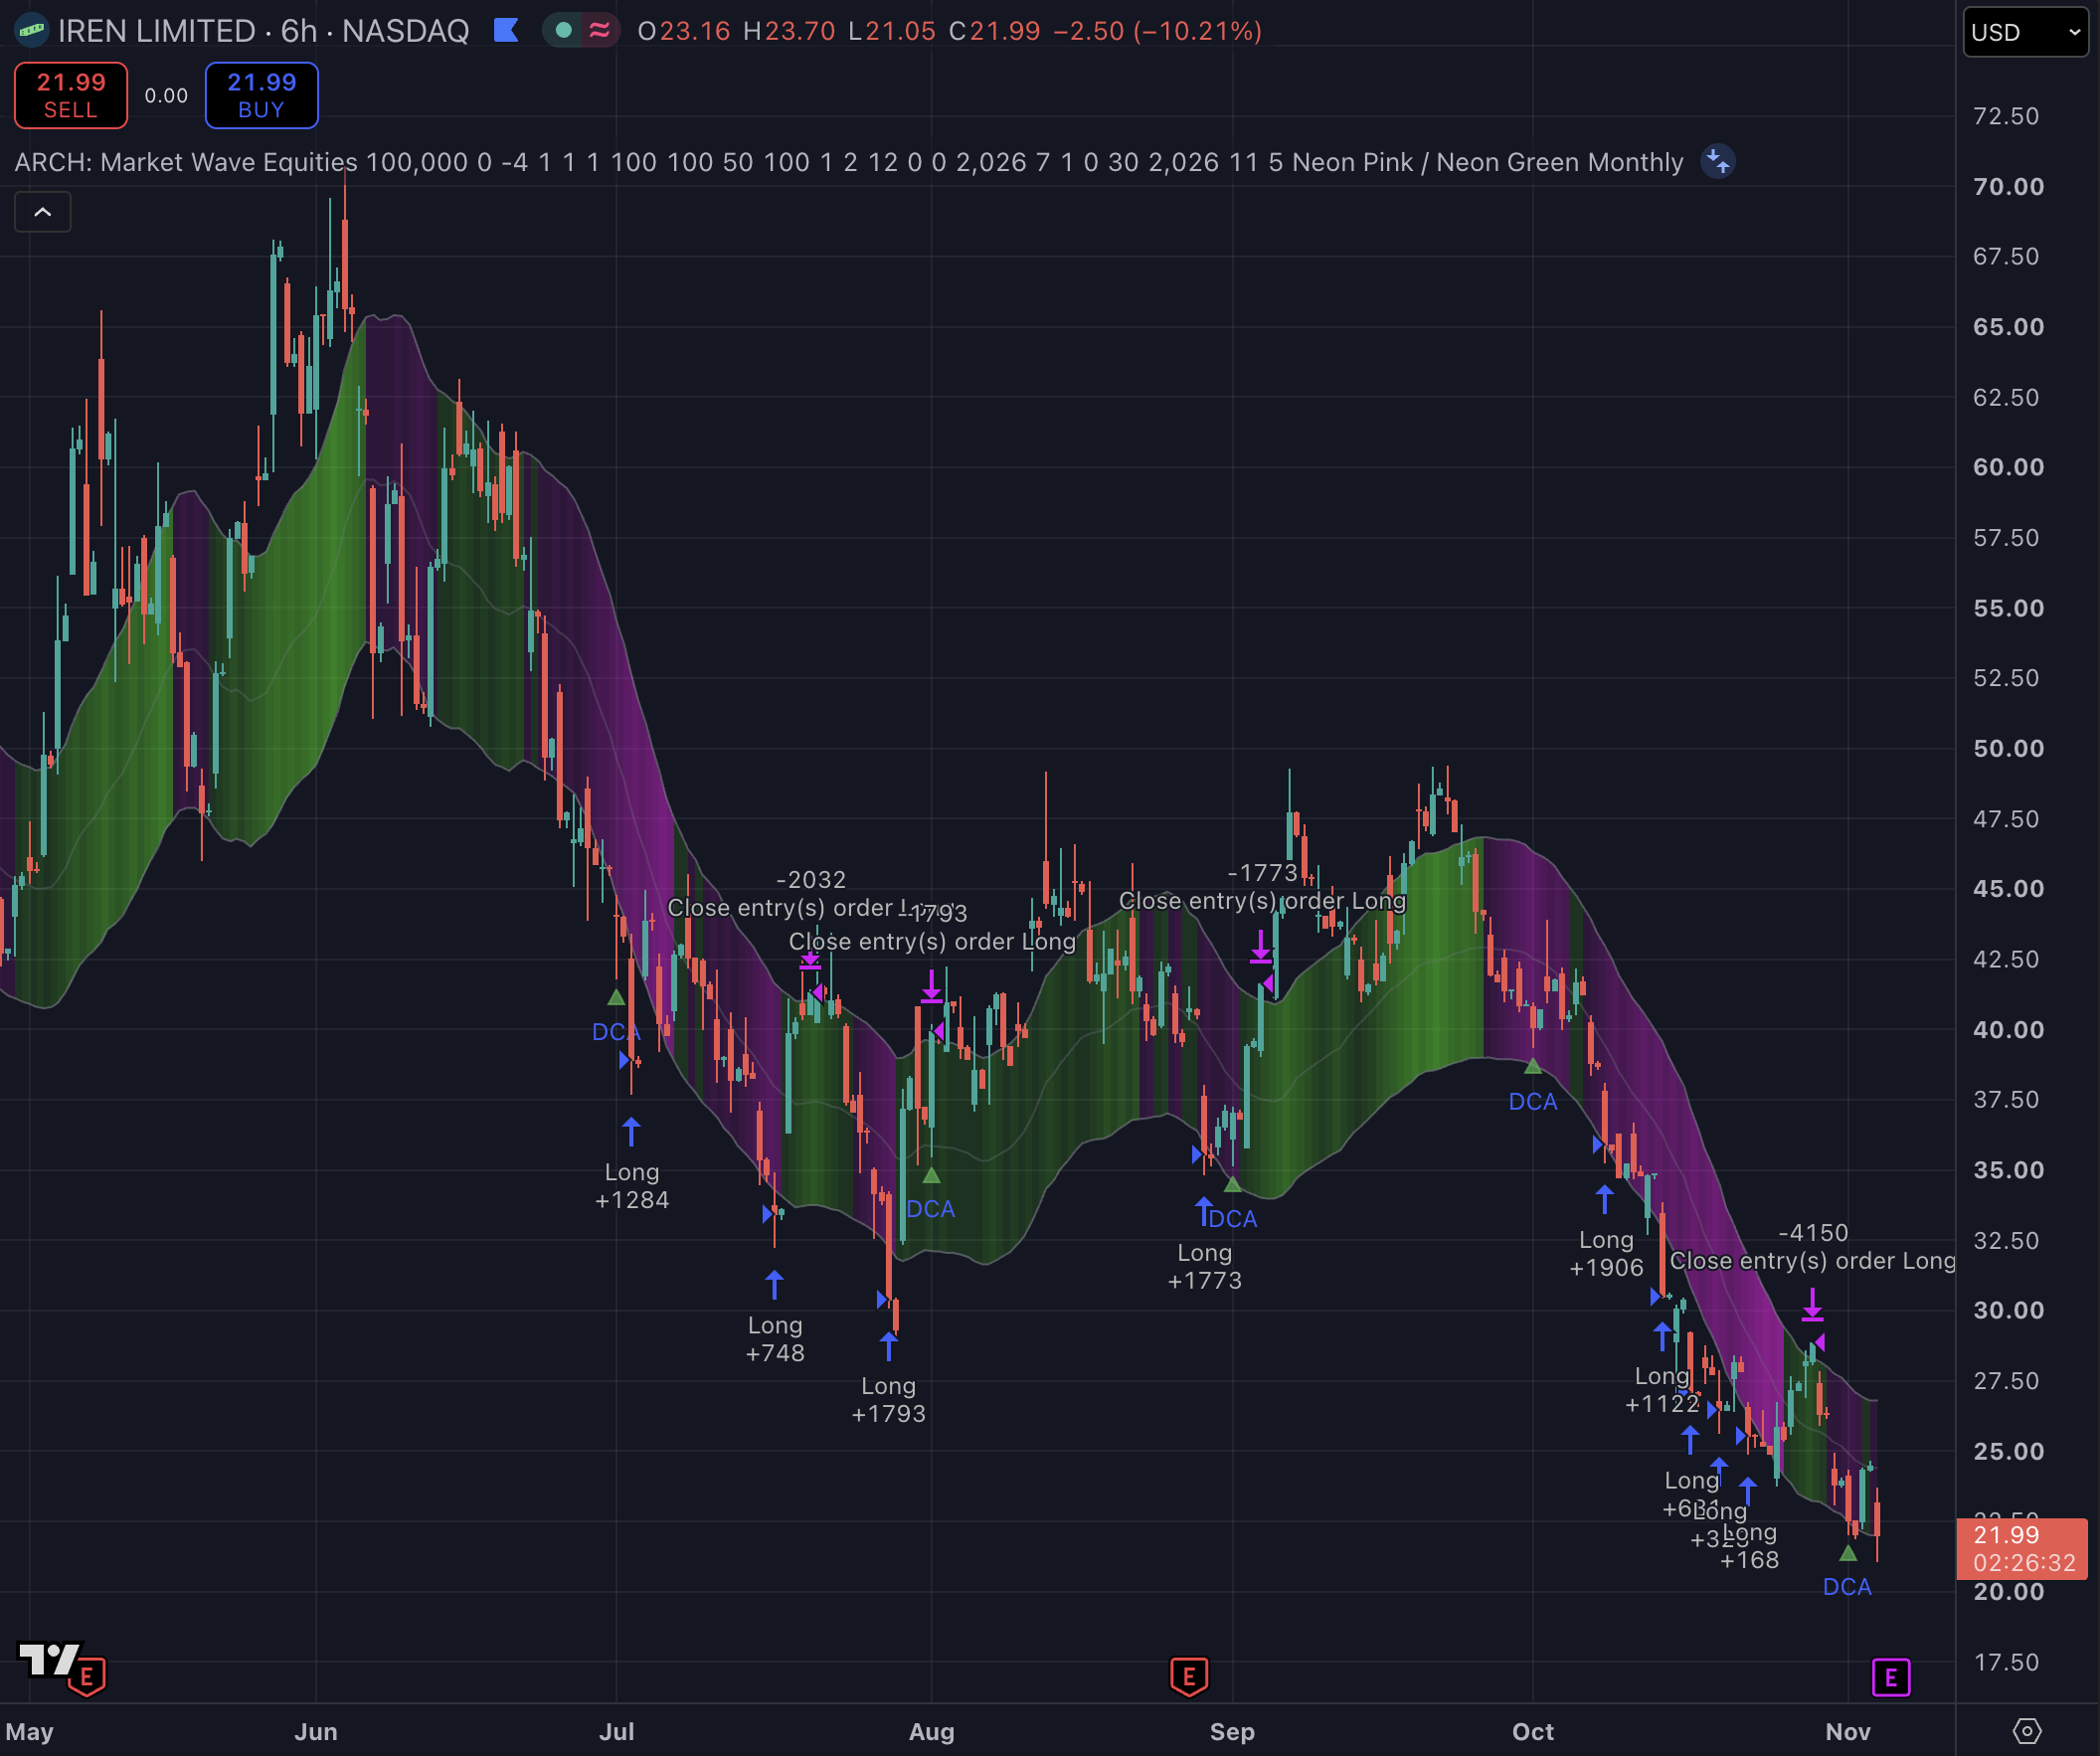
Total return over the test period, backtested.
Past and backtested performance does not guarantee future results.
Net profit
+$24,106
Ending value
$124,106
Cash profit
+$24,106
From the case study
Strategy #109, Four swings through IREN's decline, is the scenario “The four-swing slide”. Read how it played out, chart by chart.
Read the case study →The case study is dated; the results above are this strategy's published version.
The strategy buys IREN with half its available cash when the price dips below its average cost, and sells its entire position when the price rises above that cost. It repeats this across each swing and holds cash between trades, sitting out the sharpest legs down.
Exact settings come with every client account, the free tier included, in Strategy Lab Pro.
Start freeStrategy #61 · Market Wave · 1 Day chart
Backtested · 15 Oct 2025 – 6 Aug 2026
From the case study: Riding the AI wave in a stock that got cut in half
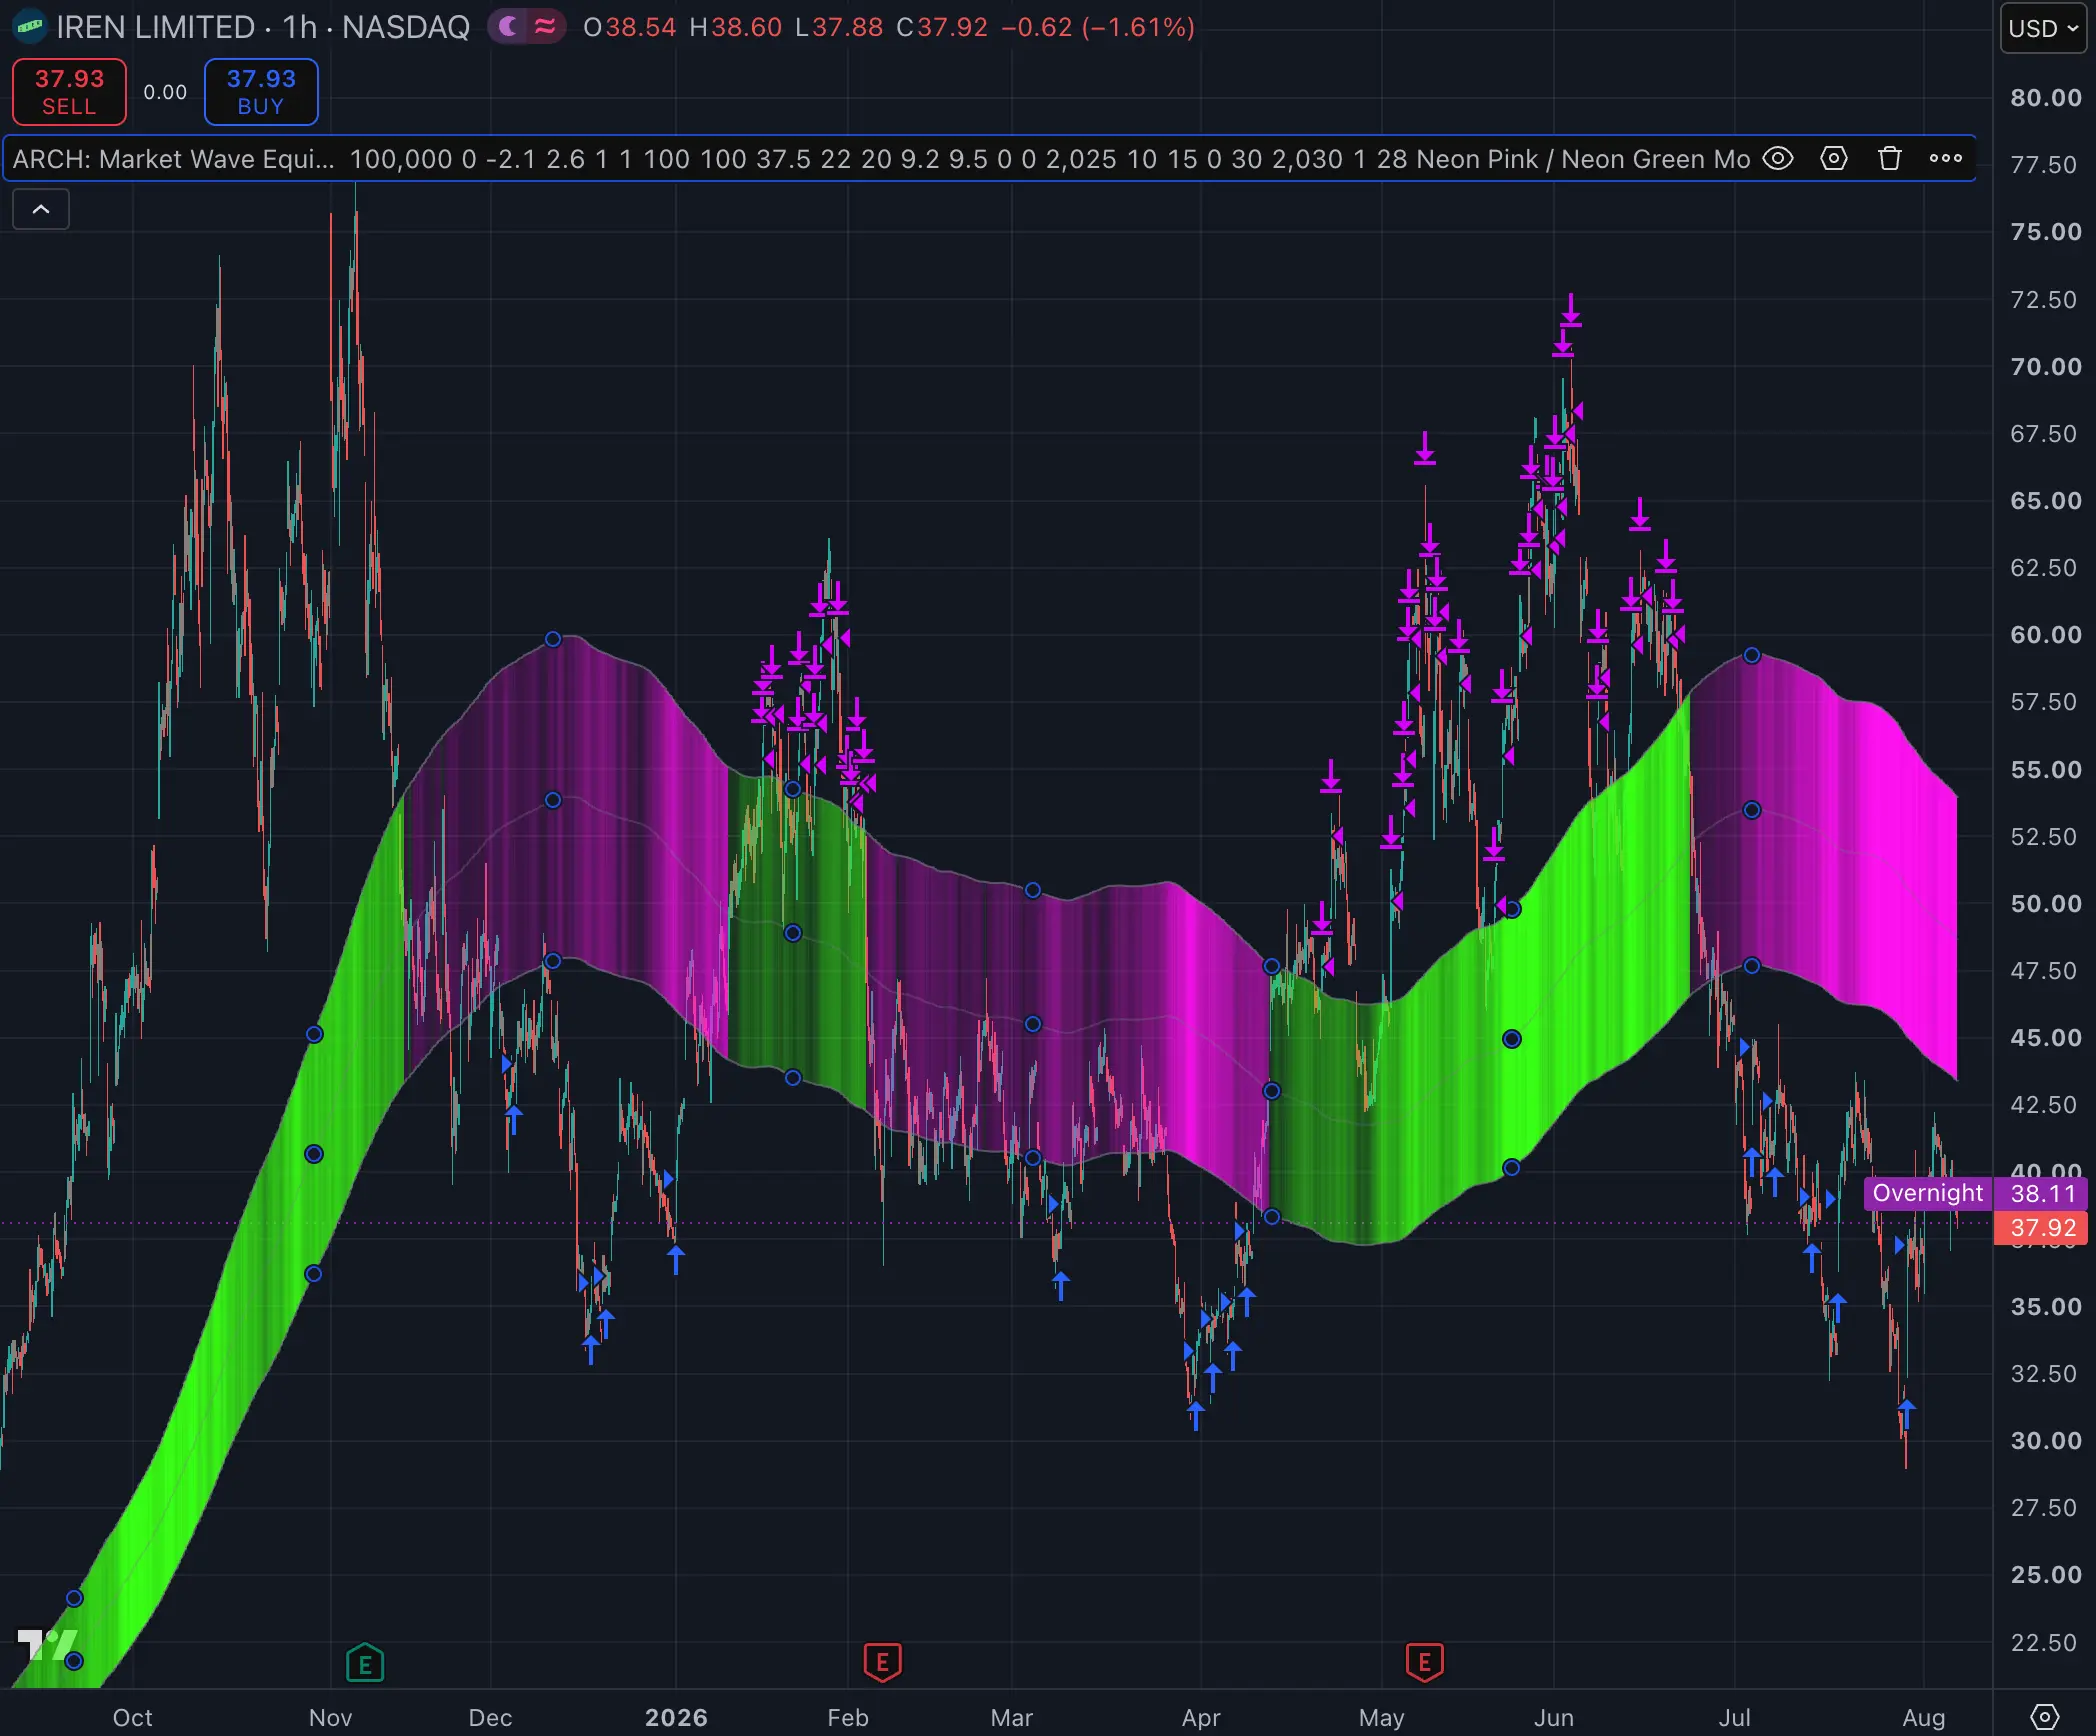
Strategy #62 · Market Wave · 1 Hour chart
Backtested · 15 Oct 2025 – 6 Aug 2026
From the case study: Riding the AI wave in a stock that got cut in half
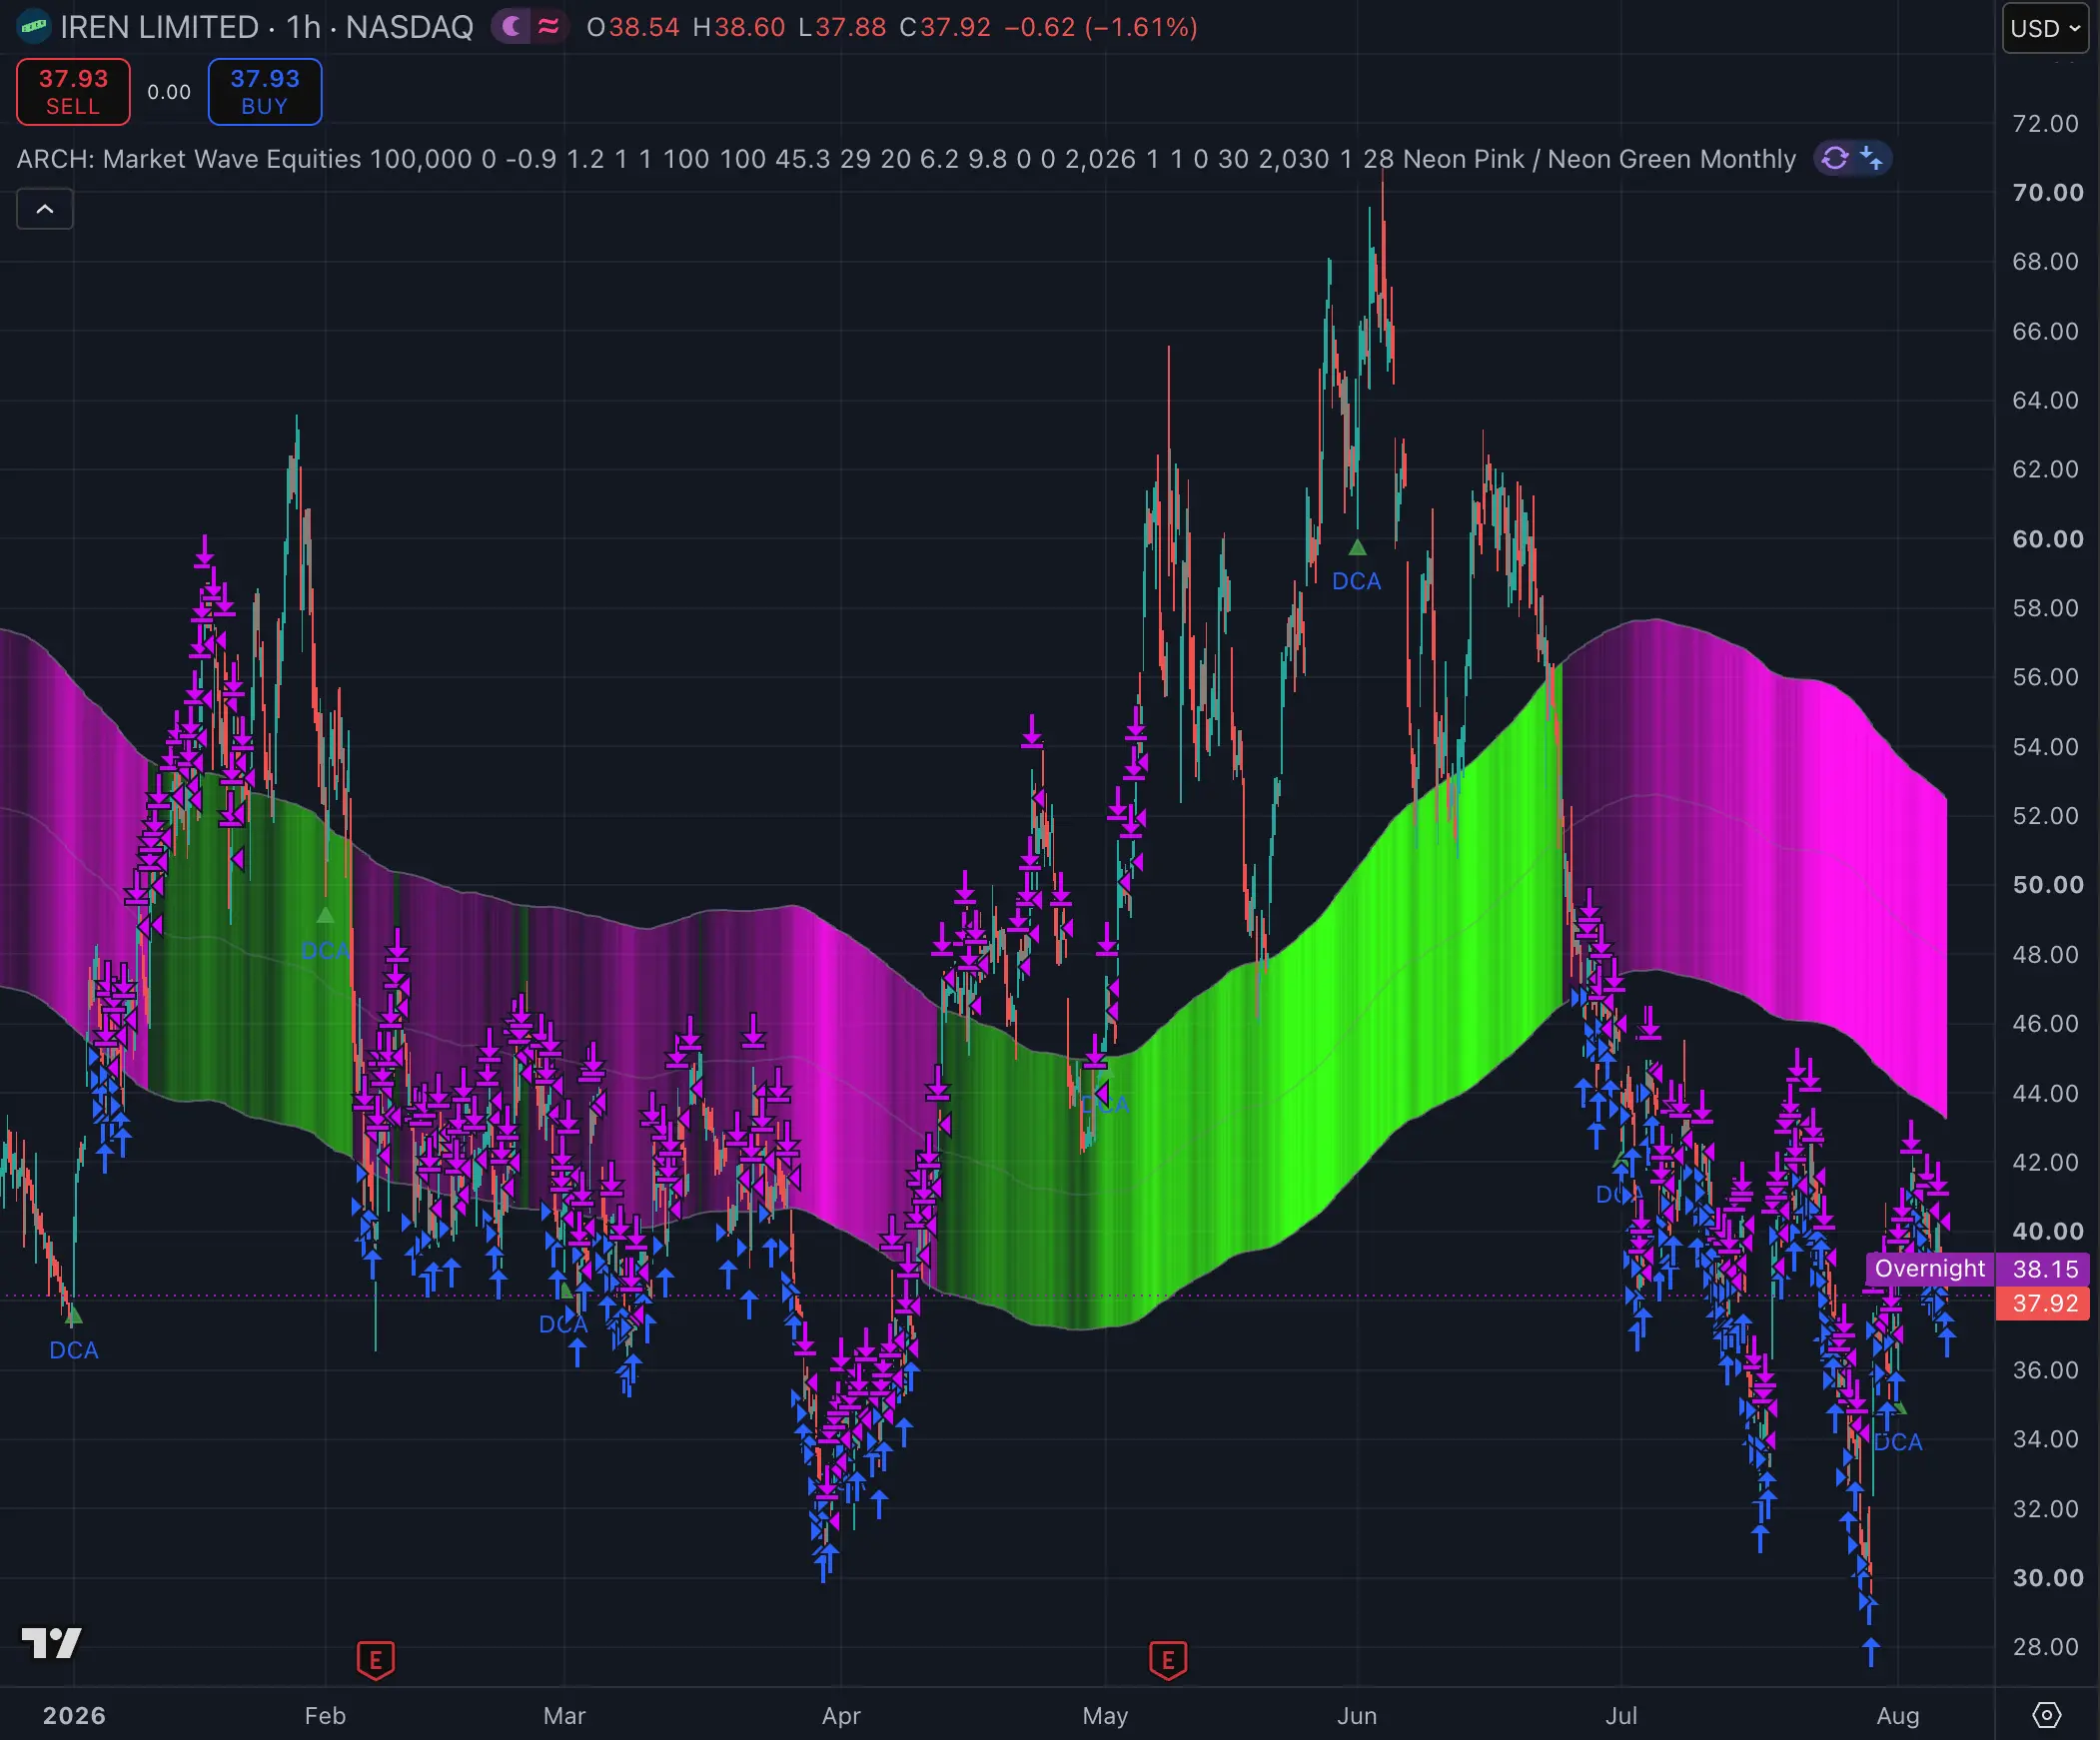
Strategy #63 · Market Wave · 1 Hour chart
Backtested · 1 Jan 2026 – 6 Aug 2026
From the case study: Riding the AI wave in a stock that got cut in half