Arch Public
GOOGLStocksBalanceShort term

A measured approach to accumulating GOOGL

Strategy #58 · GOOGL 1D · Market Wave · 1 Day chart

Backtested As of 8 Jul 2026 · 8 Jul 2024 – 8 Jul 2026 · $100,000 starting capital

Strategy return

+120.7%

Buying GOOGL monthly

+66.1%

CAGR

48.6%

The chart

Every trade from the backtest, straight from TradingView.
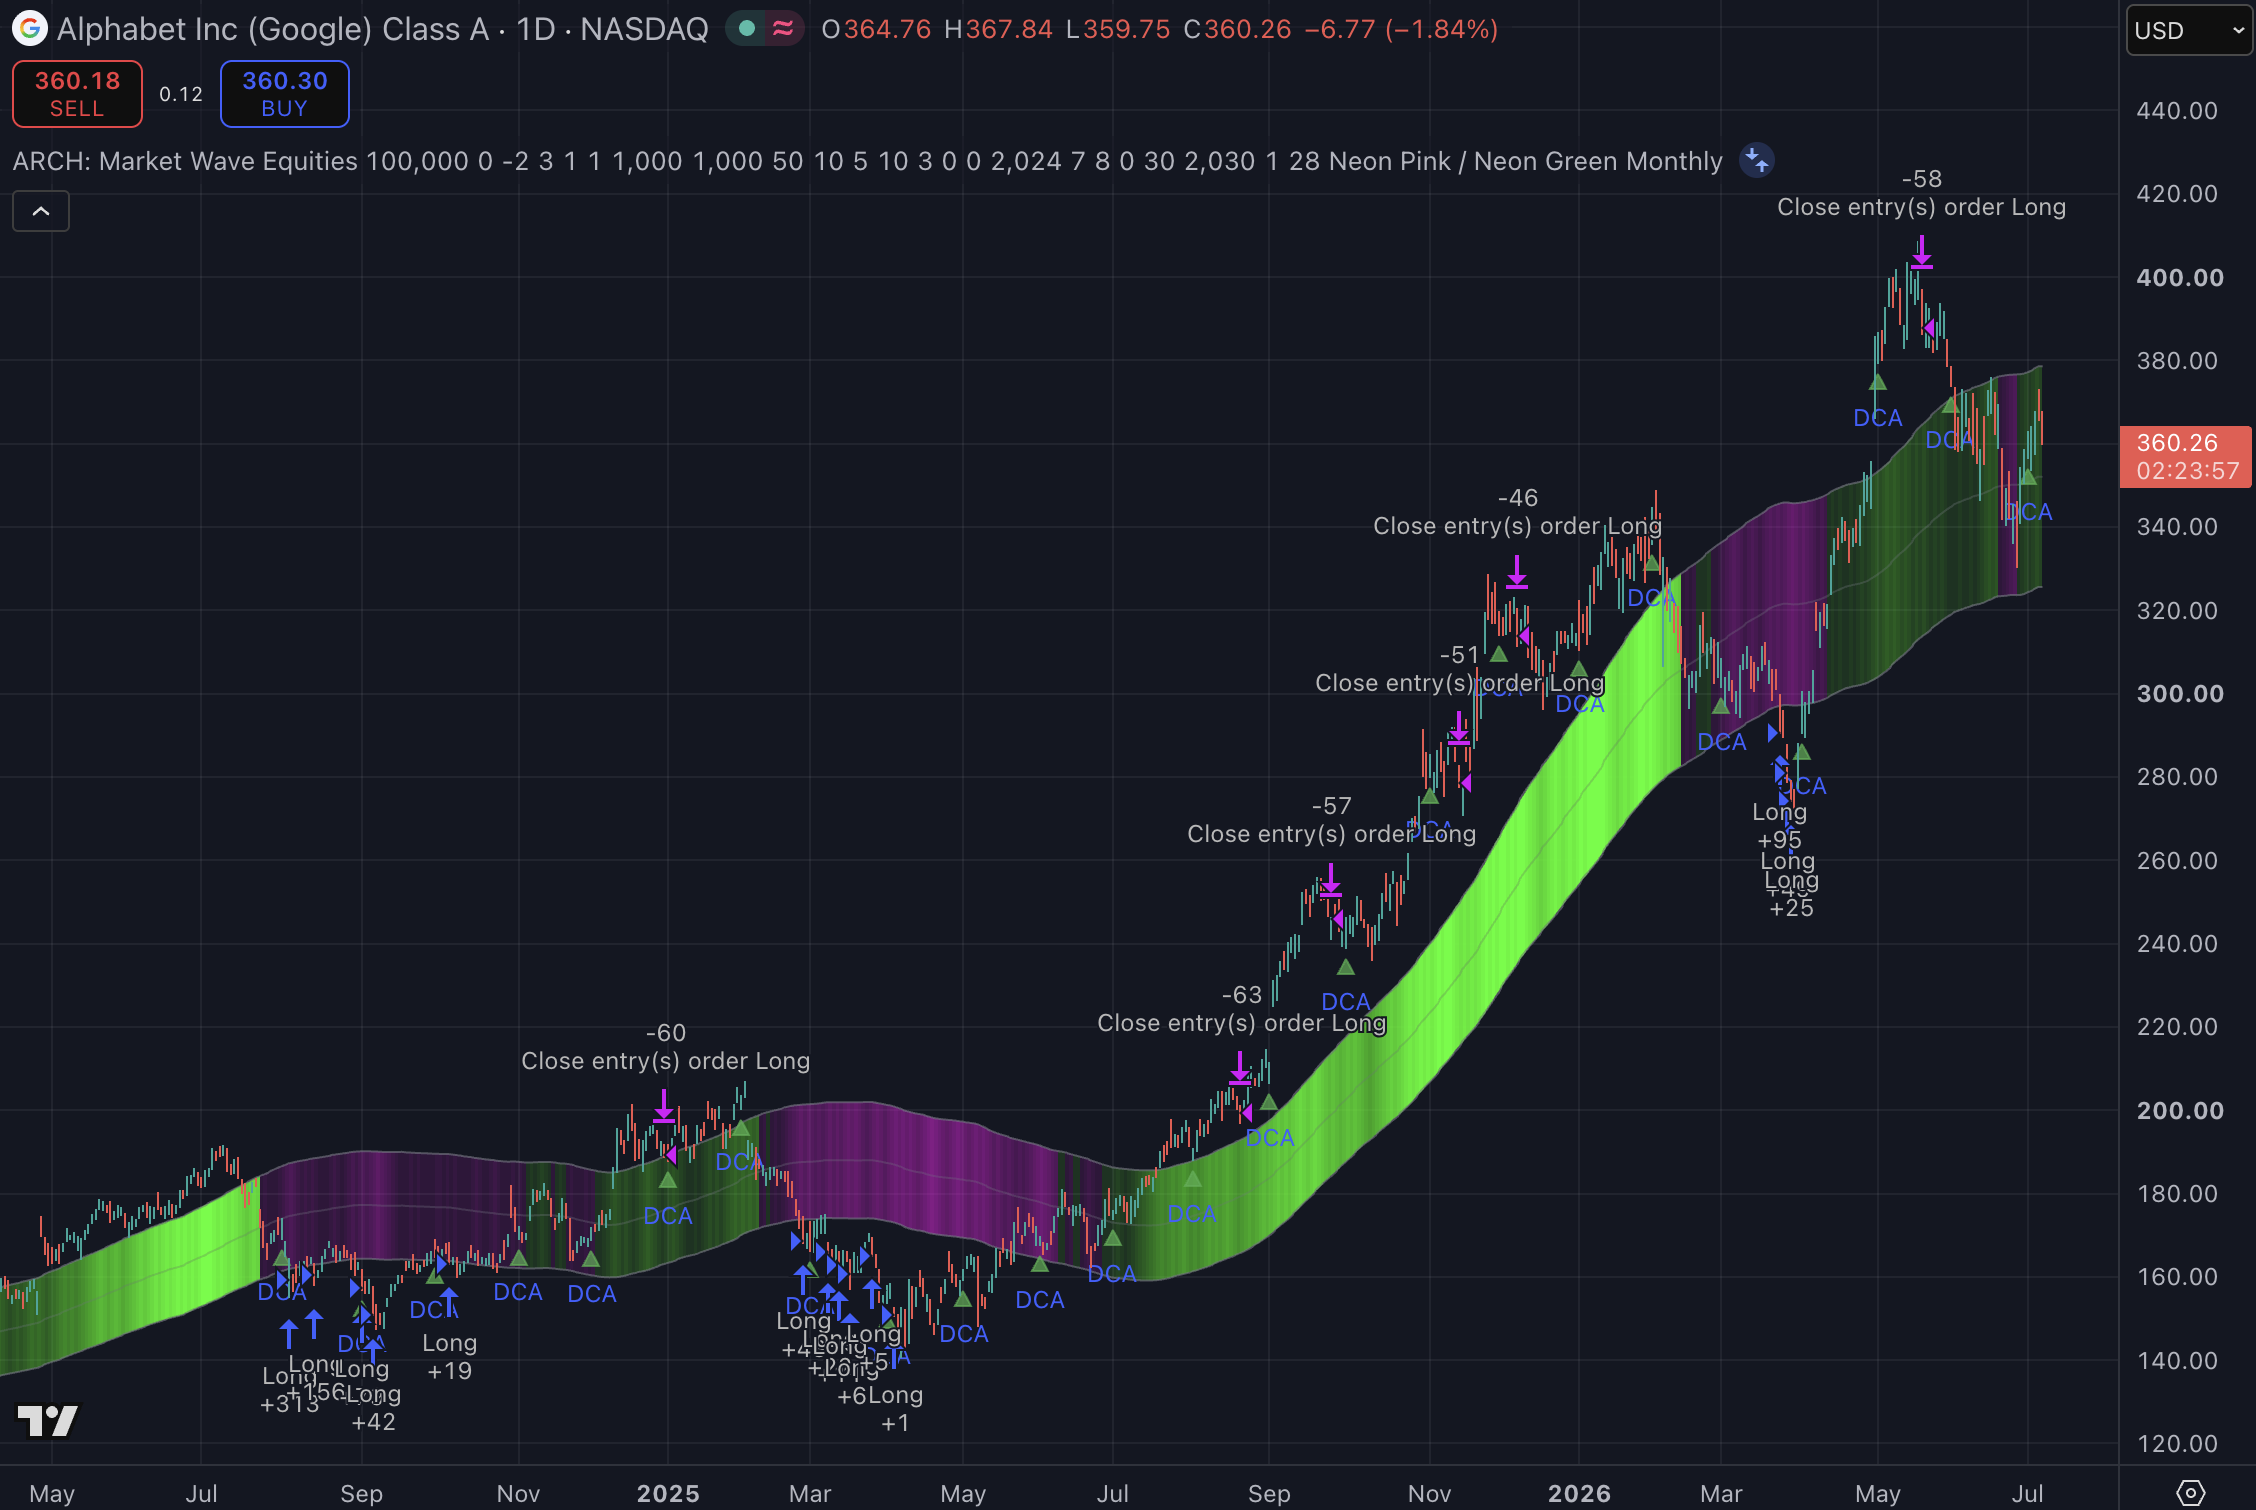
Blue arrows: buys, with order sizeMagenta marks: sells1 Day bars
TradingView backtest chart of strategy #58 on GOOGL, 1 Day, with every buy and sell marked

Against its benchmarks

GOOGL 1D+120.7%
Buying GOOGL monthly+66.1%

Total return over the test period, backtested.

Past and backtested performance does not guarantee future results.

Results at your account size

$

Net profit

+$120,672

Ending value

$220,672

Cash profit

+$35,674

Asset accumulated

531 GOOGL

We'll email this strategy's results at $100,000.

How it trades

Algorithm
Market Wave
Chart
1 Day
Horizon
Short term
Aim
Balance: aims for a mix of cash profit and more of the asset
Test period
8 Jul 2024 – 8 Jul 2026
Starting capital
$100,000
Fees and slippage
Not stated
Data source
TradingView backtest

Exact settings come with every client account, the free tier included, in Strategy Lab Pro.

Start free
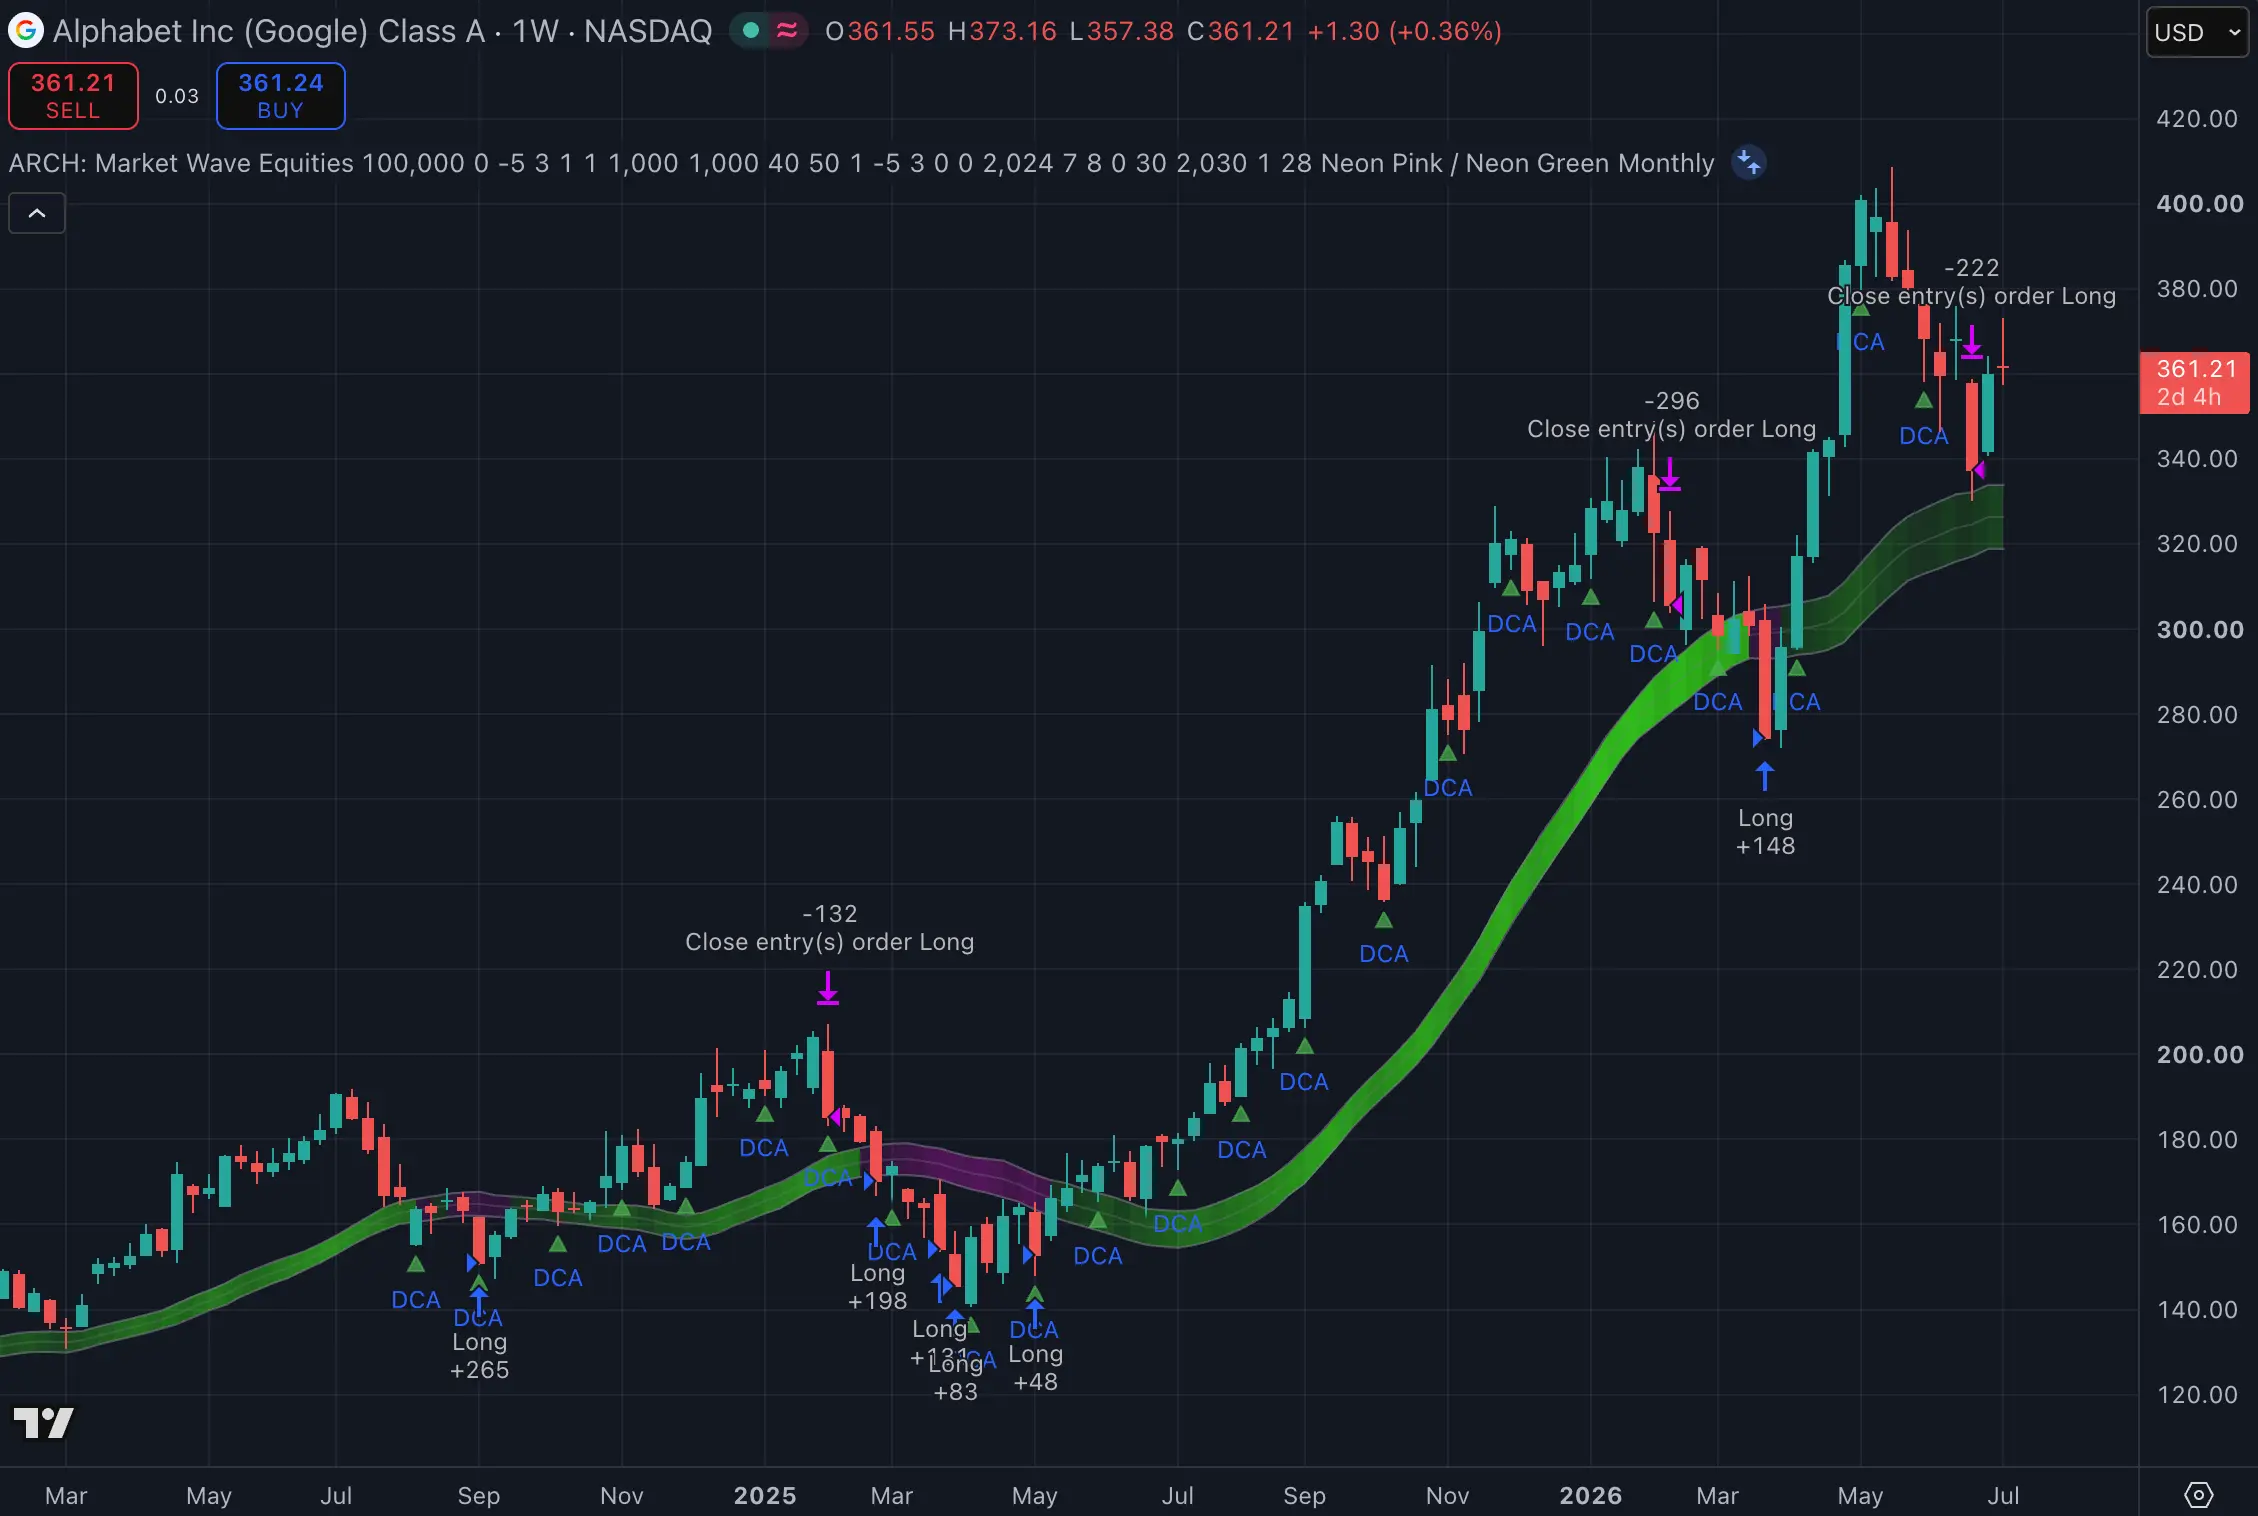
TradingView backtest chart of strategy #57 on GOOGL, 1 Week, with every buy and sell marked
GOOGLStocksBalance

Swing Trade the GOOGL trend

Strategy #57 · Market Wave · 1 Week chart

Strategy+116.4%
Buy and hold GOOGL+95.0%

Backtested · 8 Jul 2024 – 8 Jul 2026

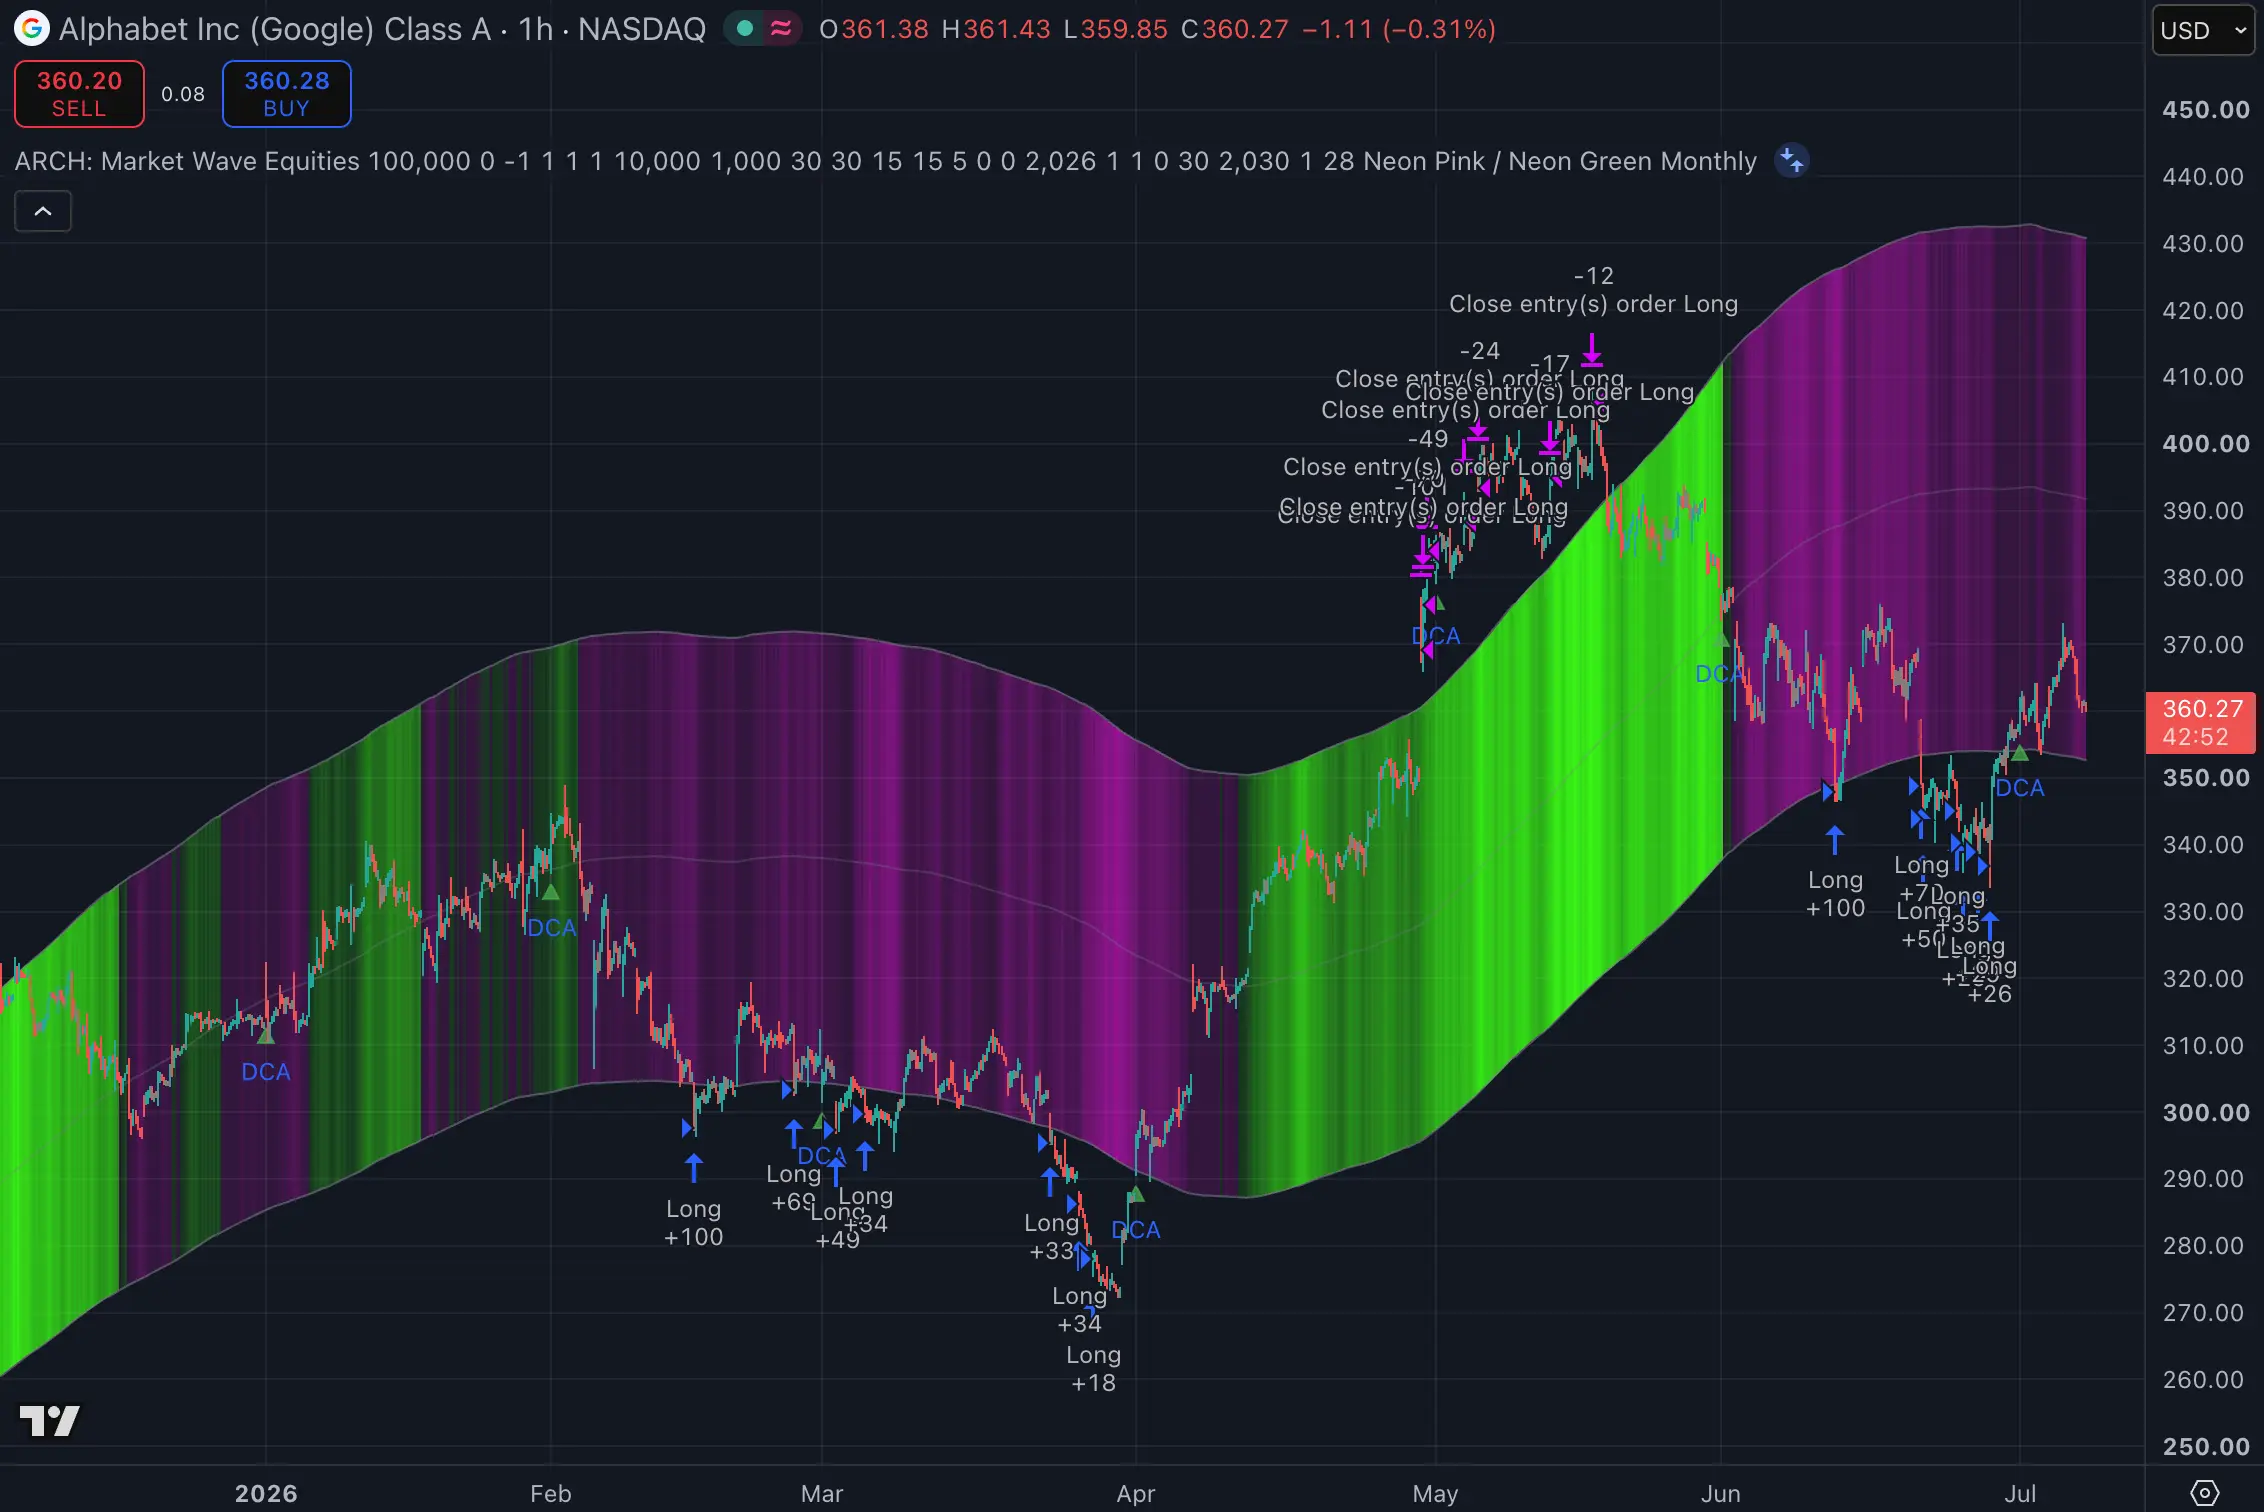
TradingView backtest chart of strategy #59 on GOOGL, 1 Hour, with every buy and sell marked
GOOGLStocksCash yield

Scalping short term on GOOGL

Strategy #59 · Market Wave · 1 Hour chart

Strategy+32.7%
Buying GOOGL monthly+7.8%

Backtested · 1 Jan 2026 – 8 Jul 2026

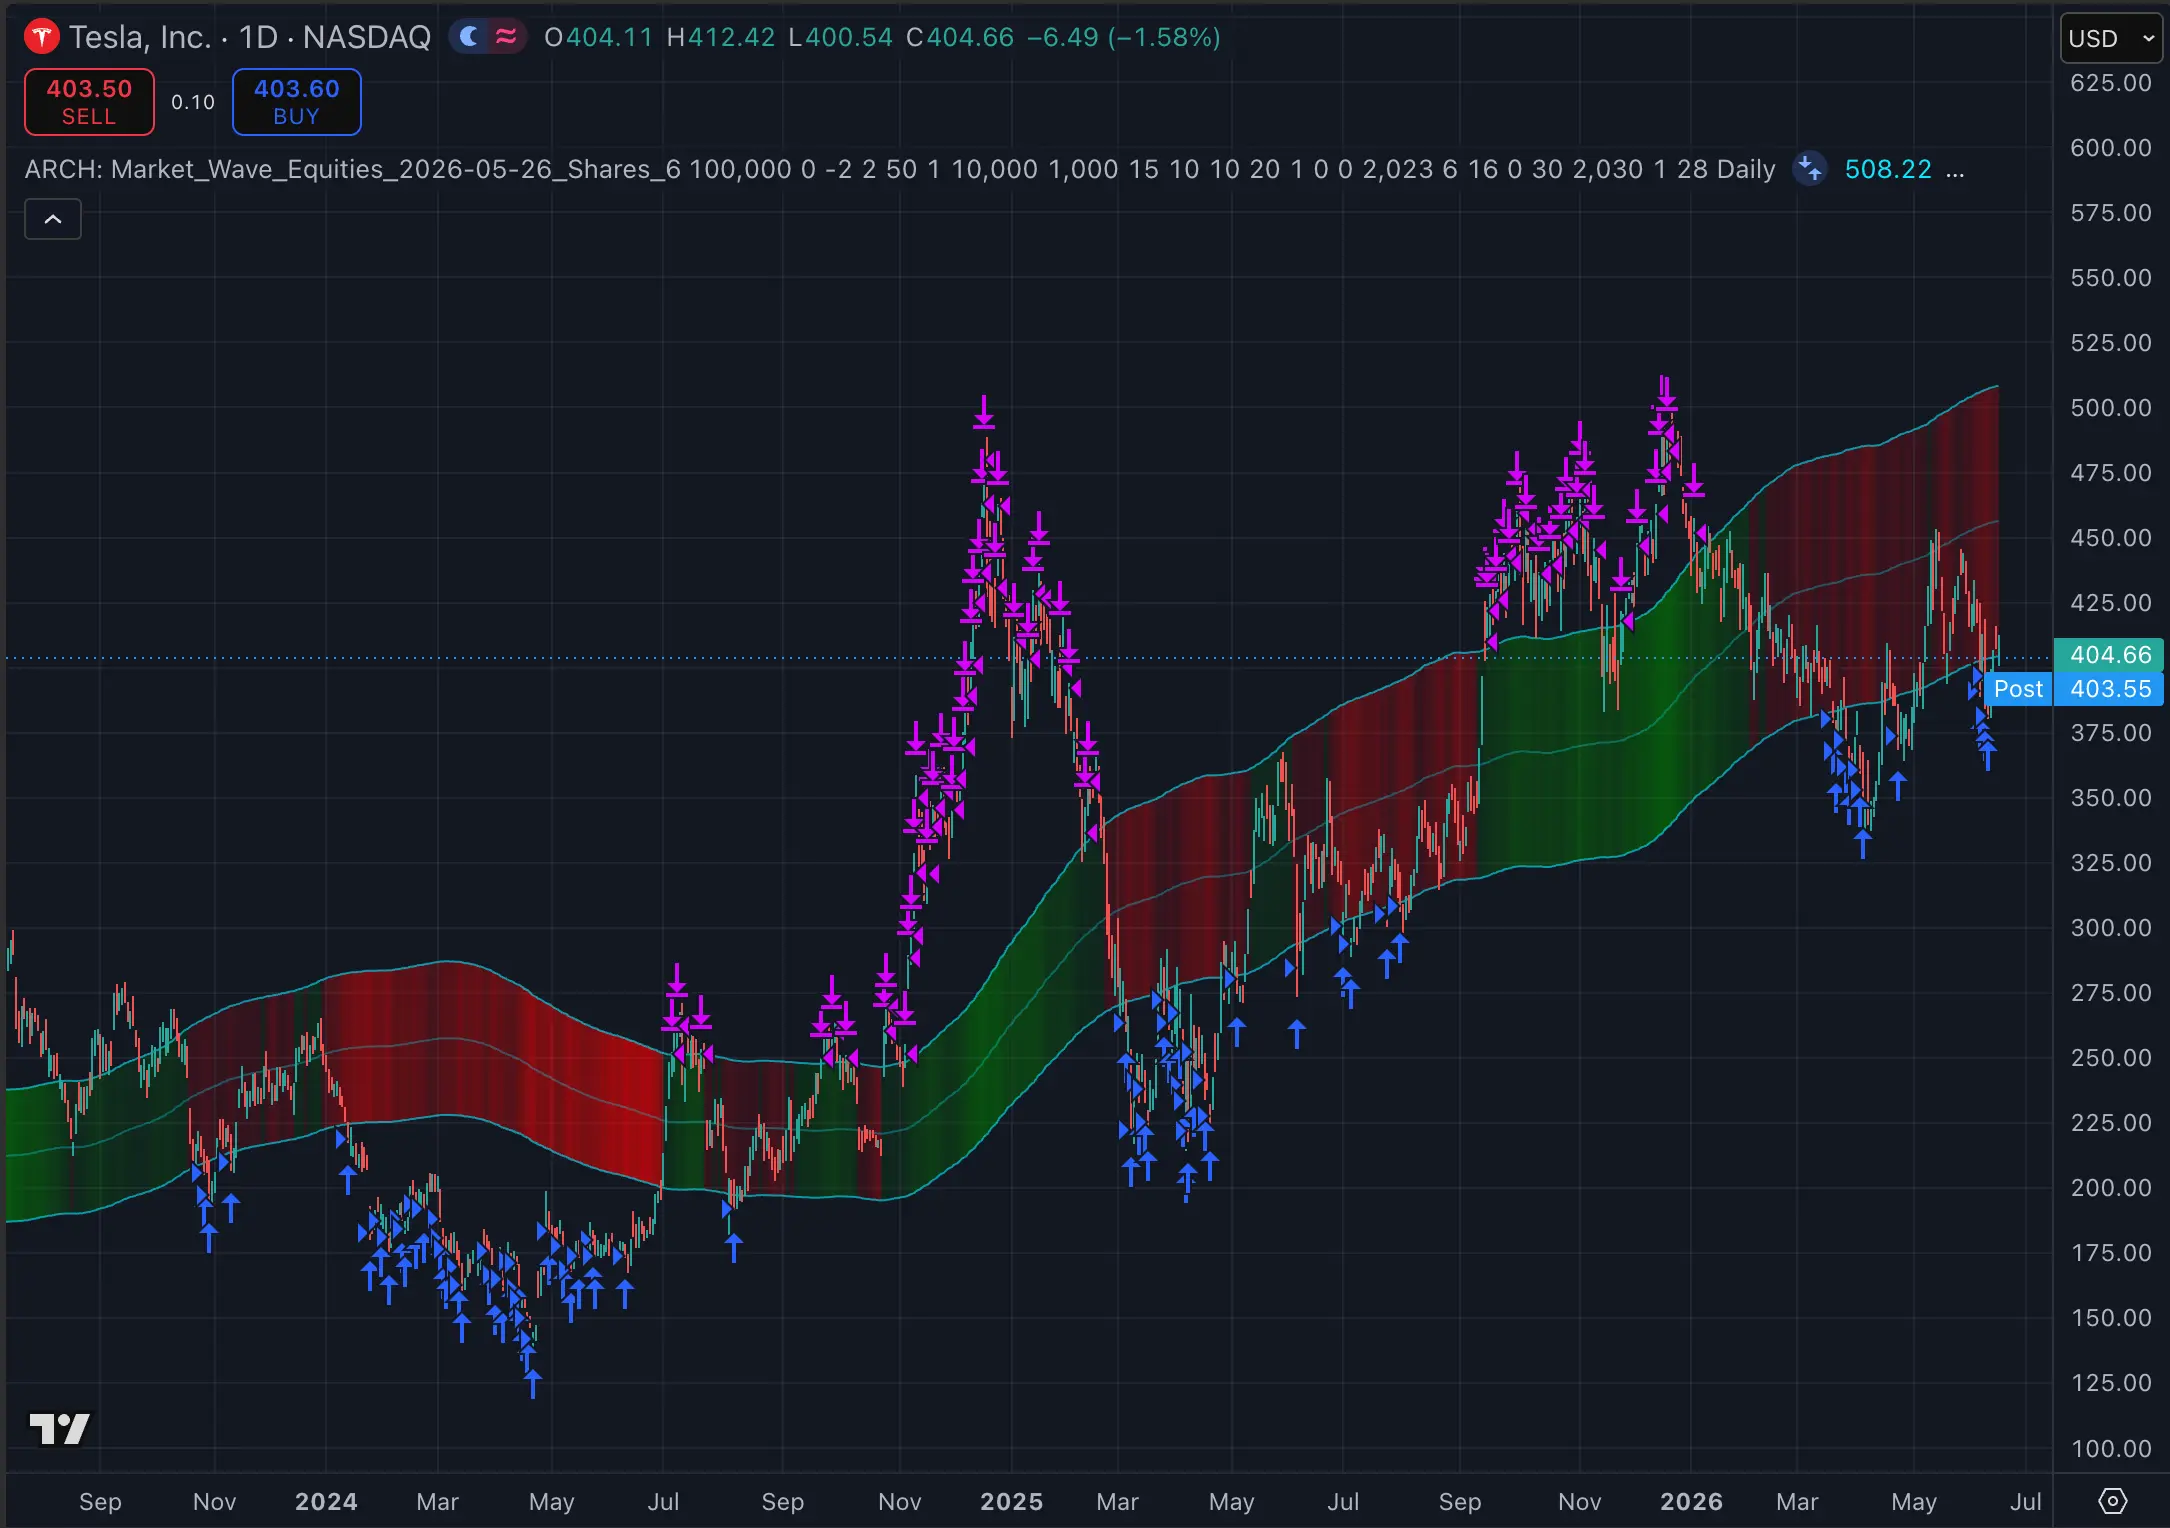
TradingView backtest chart of strategy #49 on TSLA, 1 Day, with every buy and sell marked
TSLAStocksBalance

Swing Trading TSLA

Strategy #49 · Market Wave · 1 Day chart

Strategy+184.6%
Buy and hold TSLA+55.3%

Backtested · 16 Jun 2023 – 16 Jun 2026

Start free