
NVDAStocksCash yield
Cash Yield from a rising NVDA
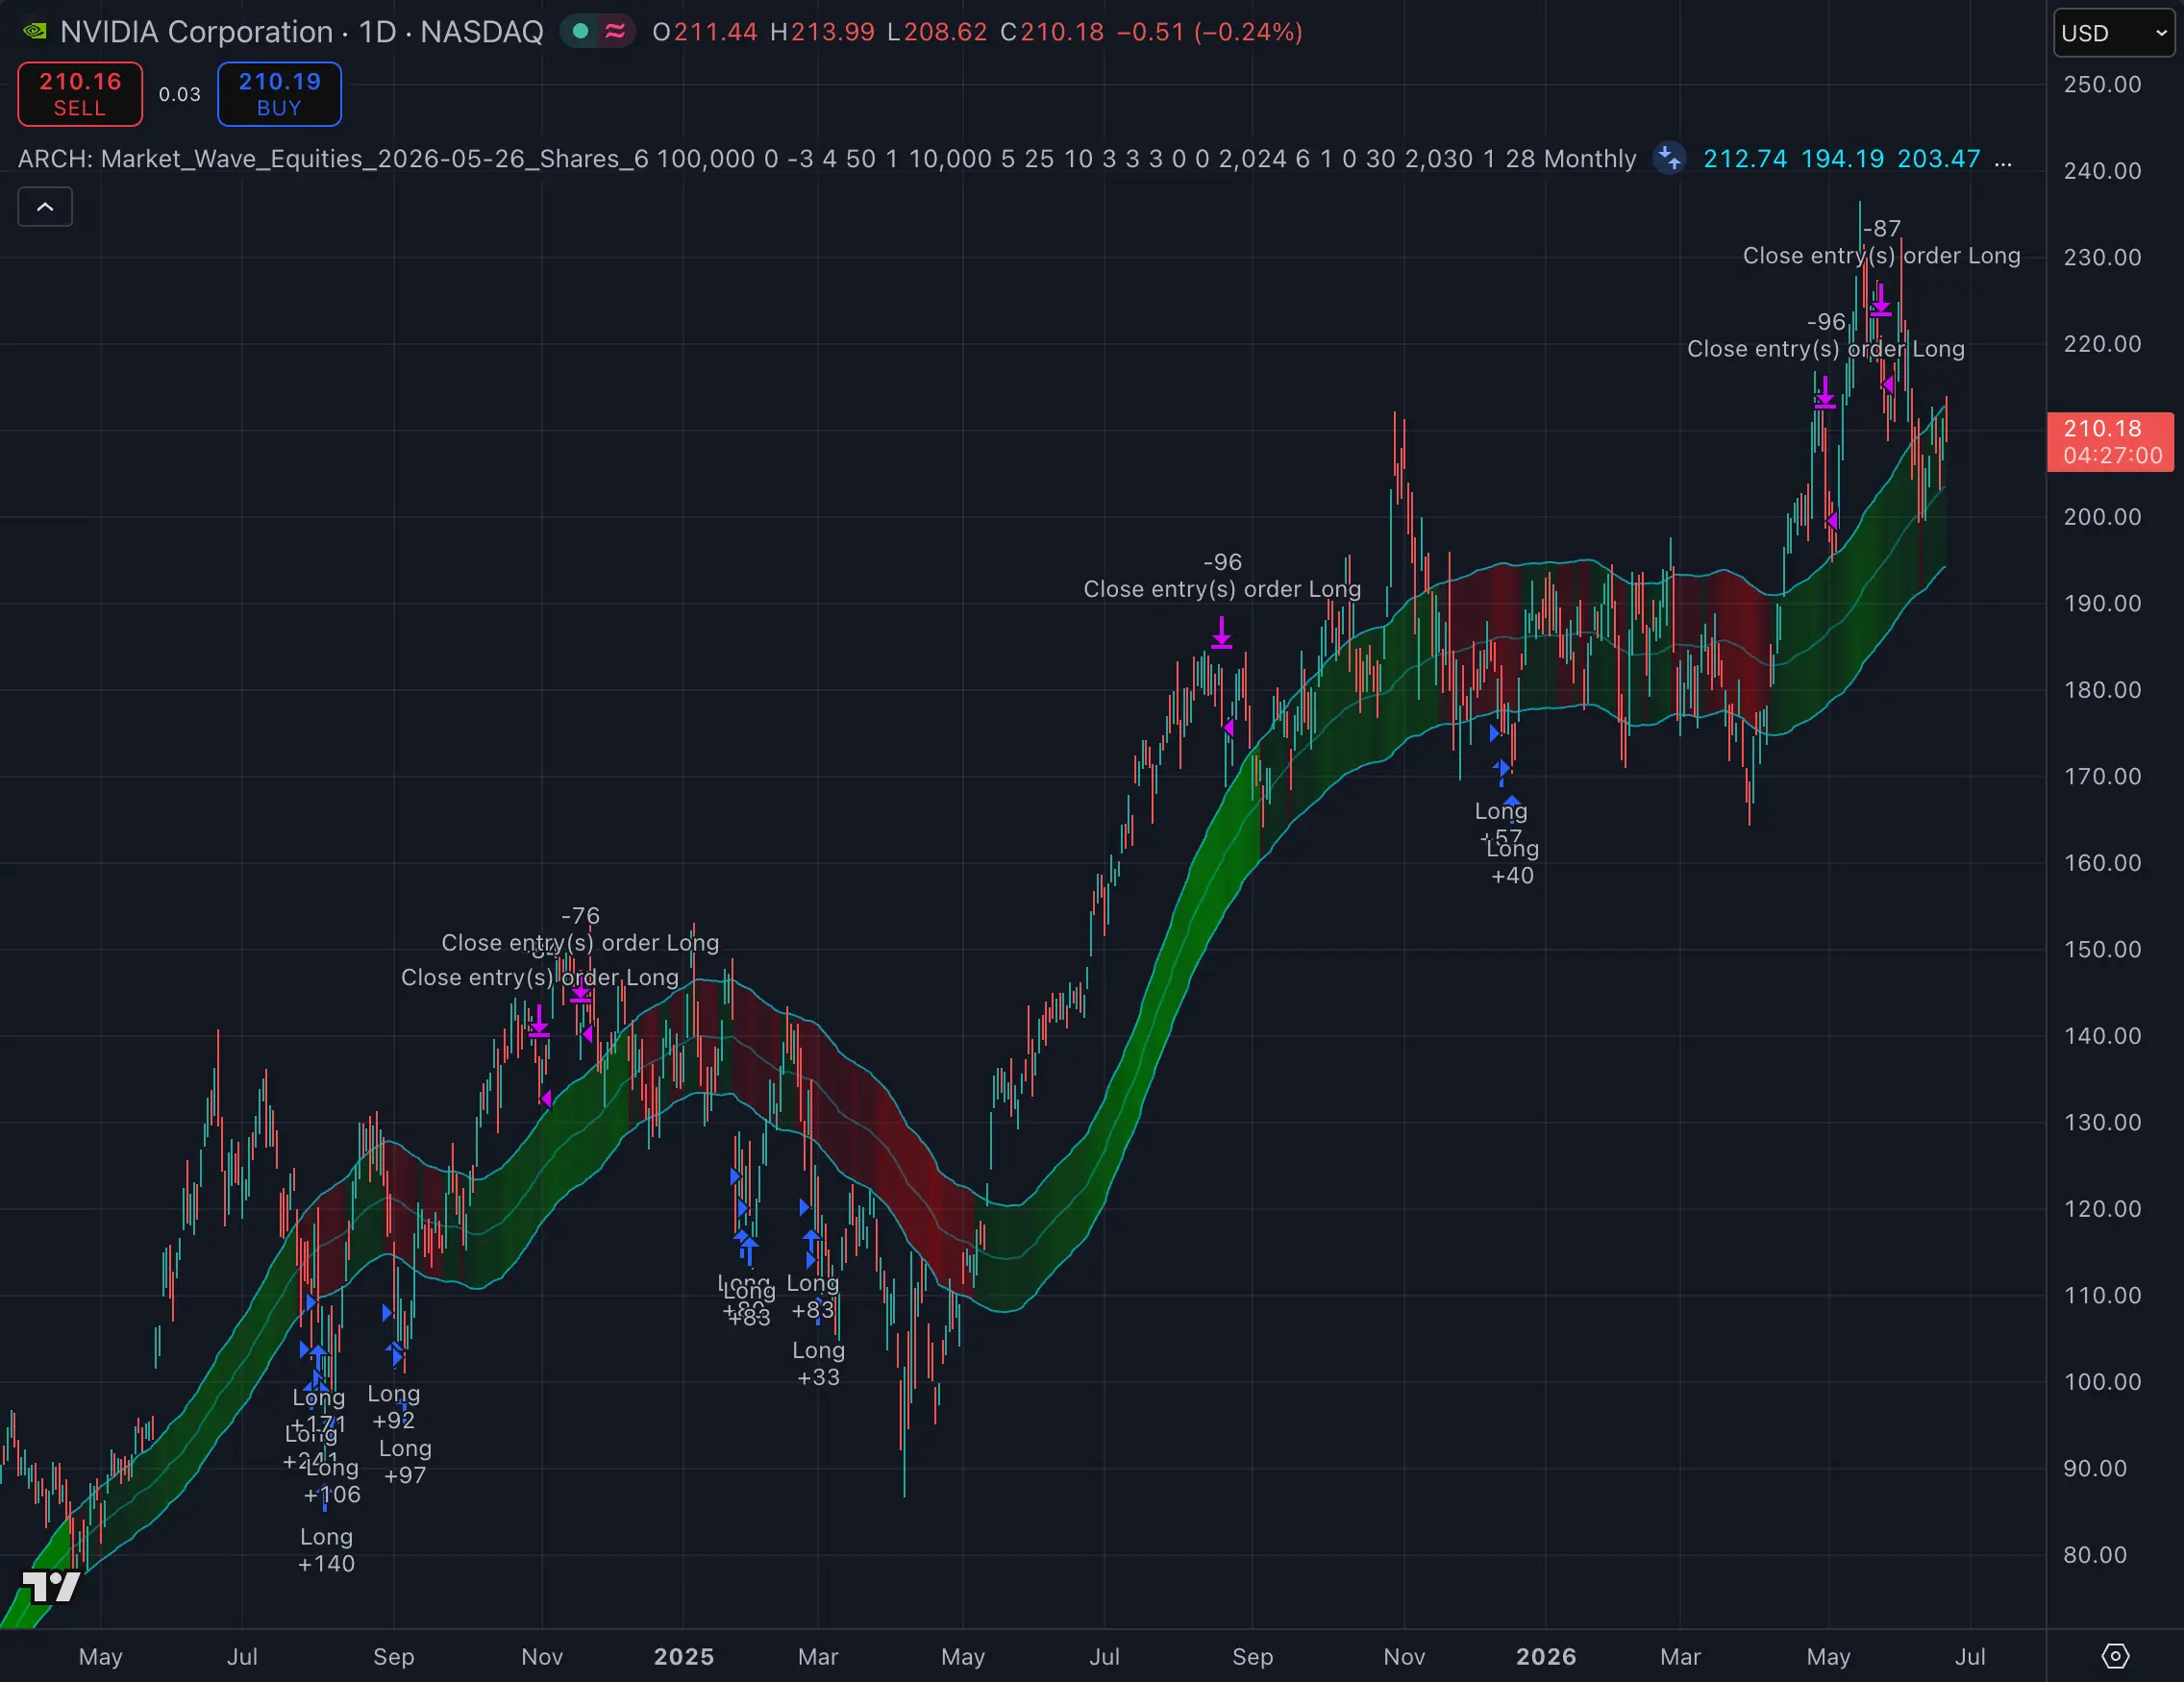
Strategy #50 · Market Wave · 1 Day chart
Strategy+102.8%
Buy and hold NVDA+82.8%
Backtested · 1 Jun 2024 – 1 Jun 2026
Strategy #51 · NVDA 1h · Market Wave · 1 Hour chart
Backtested As of 7 Aug 2026 · 22 Jul 2025 – 22 Jul 2026 · $100,000 starting capital
Strategy return
+74.9%
Buy and hold NVDA
+26.3%
Test length
1 year
CAGR not shown under a year
Every trade from the backtest, straight from TradingView.
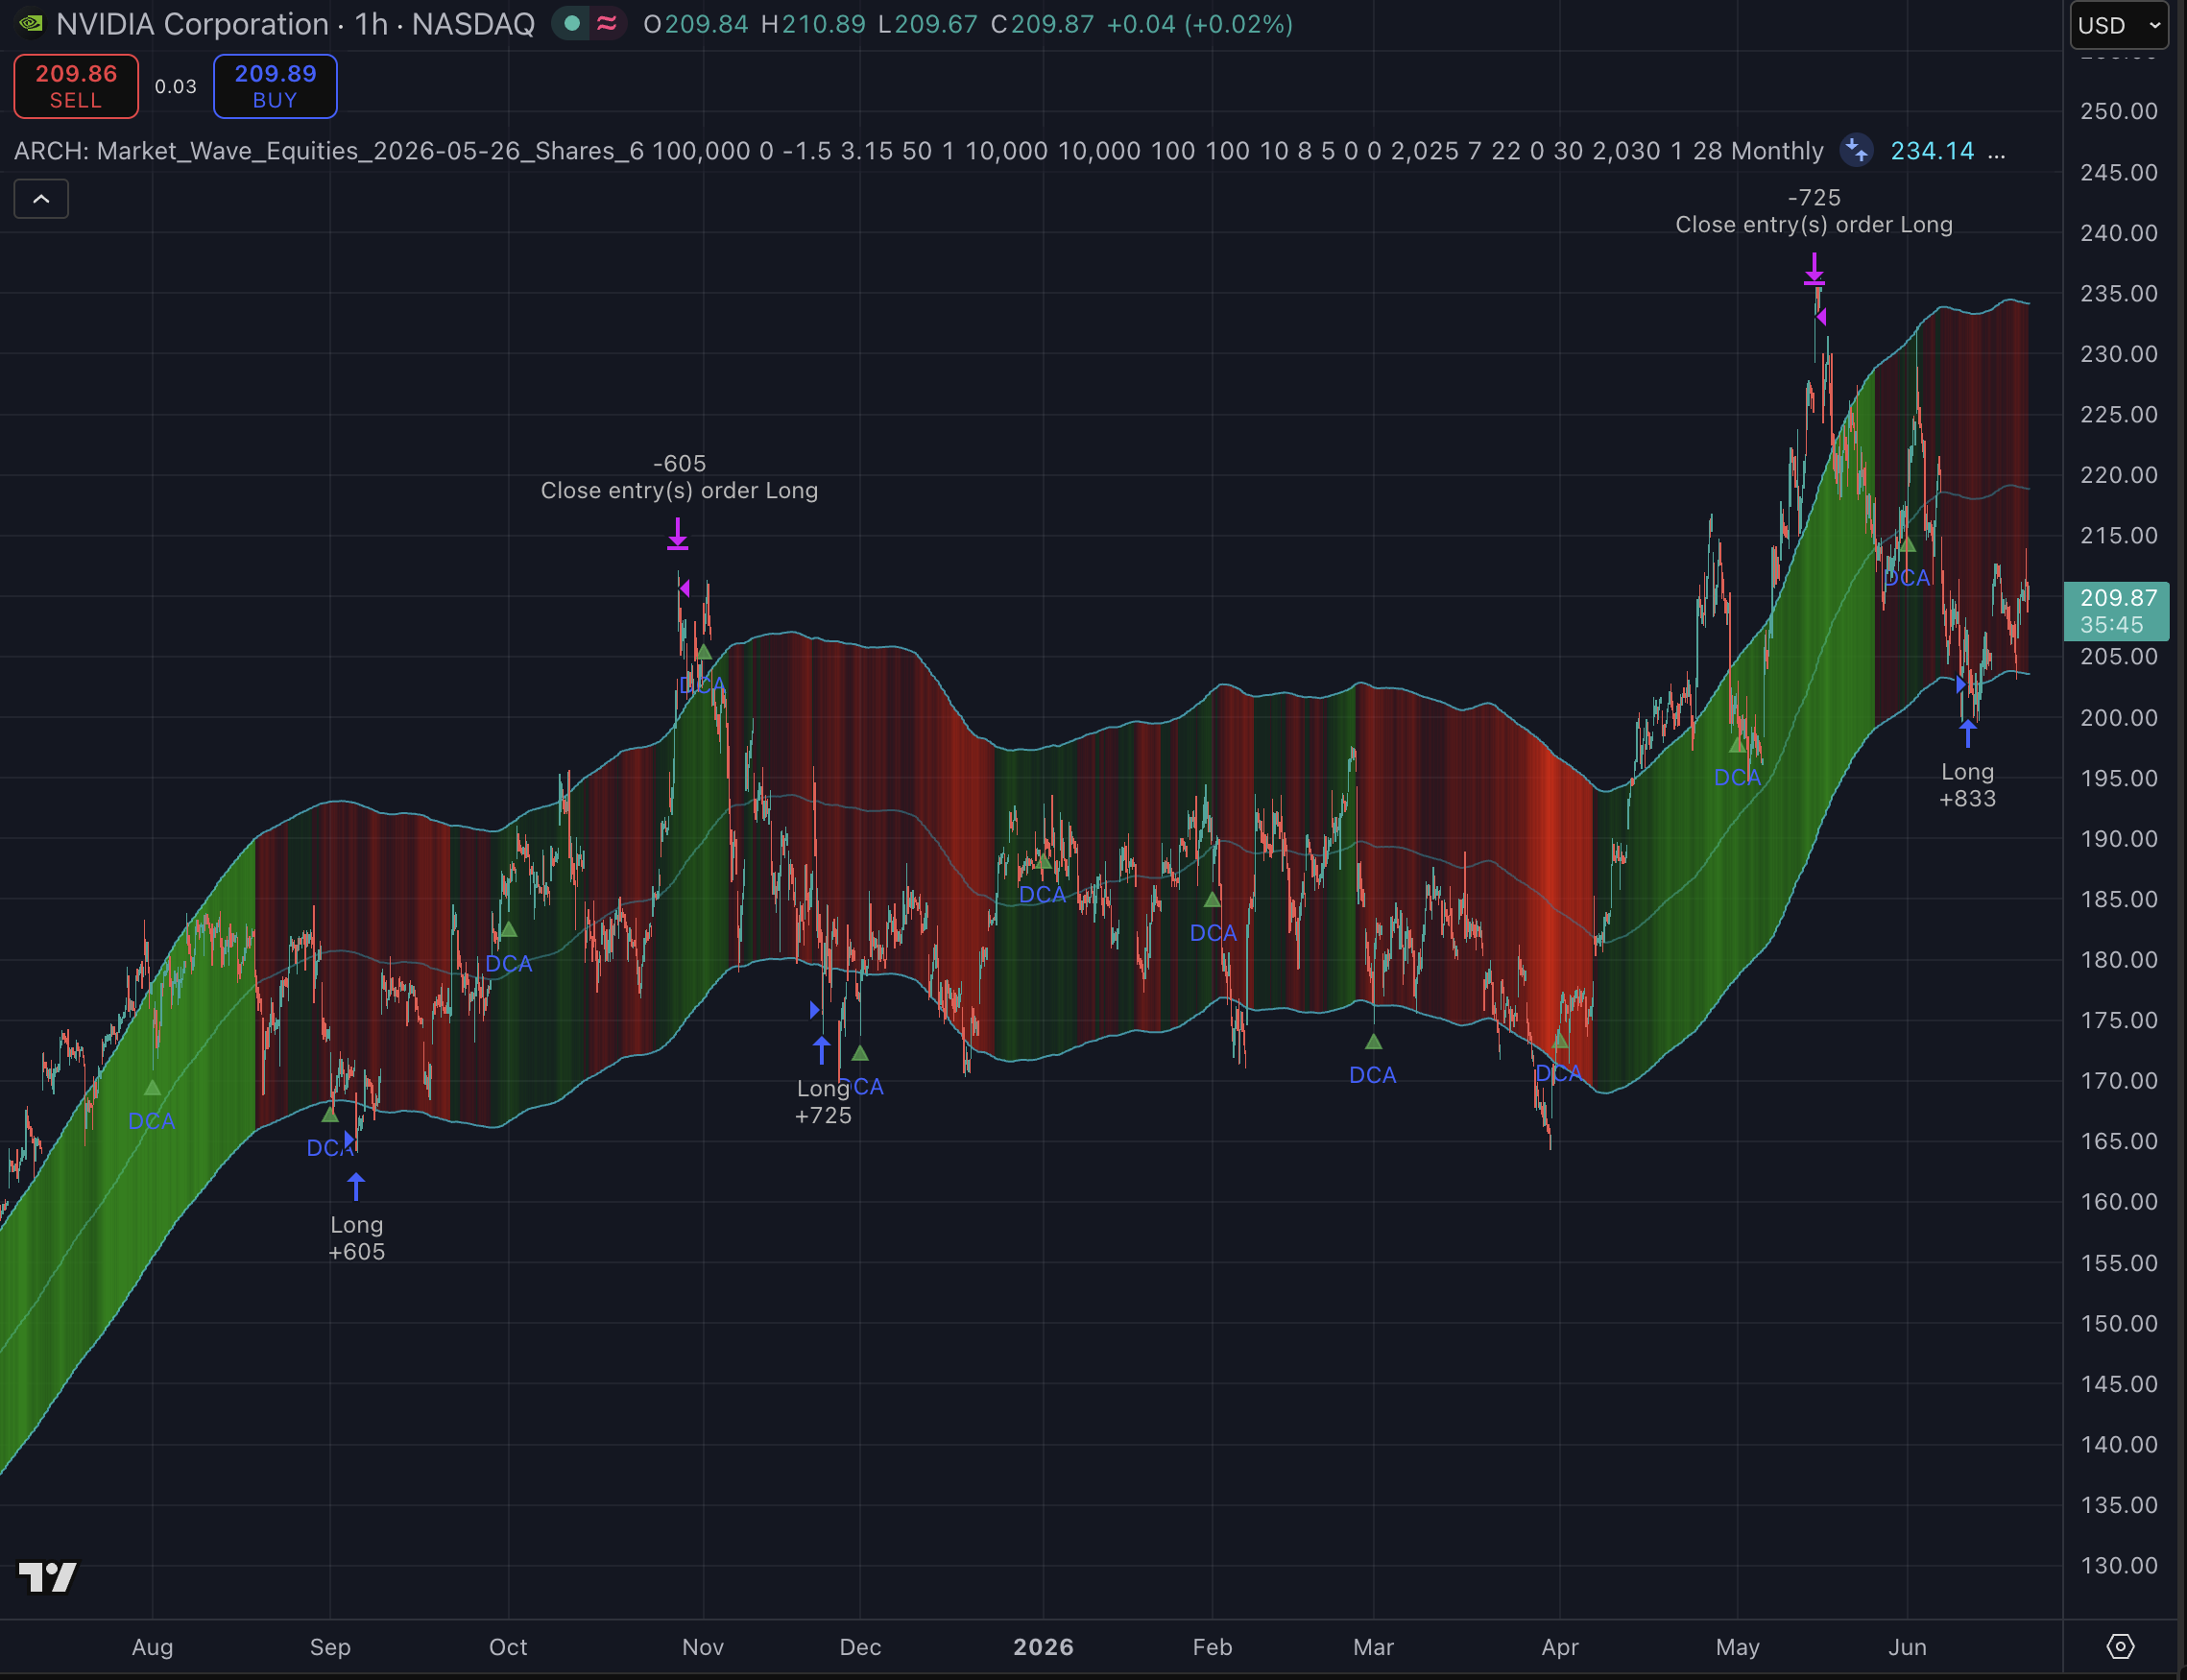
Total return over the test period, backtested.
Past and backtested performance does not guarantee future results.
Net profit
+$74,895
Ending value
$174,895
Cash profit
+$69,005
Asset accumulated
833 NVDA
Exact settings come with every client account, the free tier included, in Strategy Lab Pro.
Start freeStrategy #50 · Market Wave · 1 Day chart
Backtested · 1 Jun 2024 – 1 Jun 2026
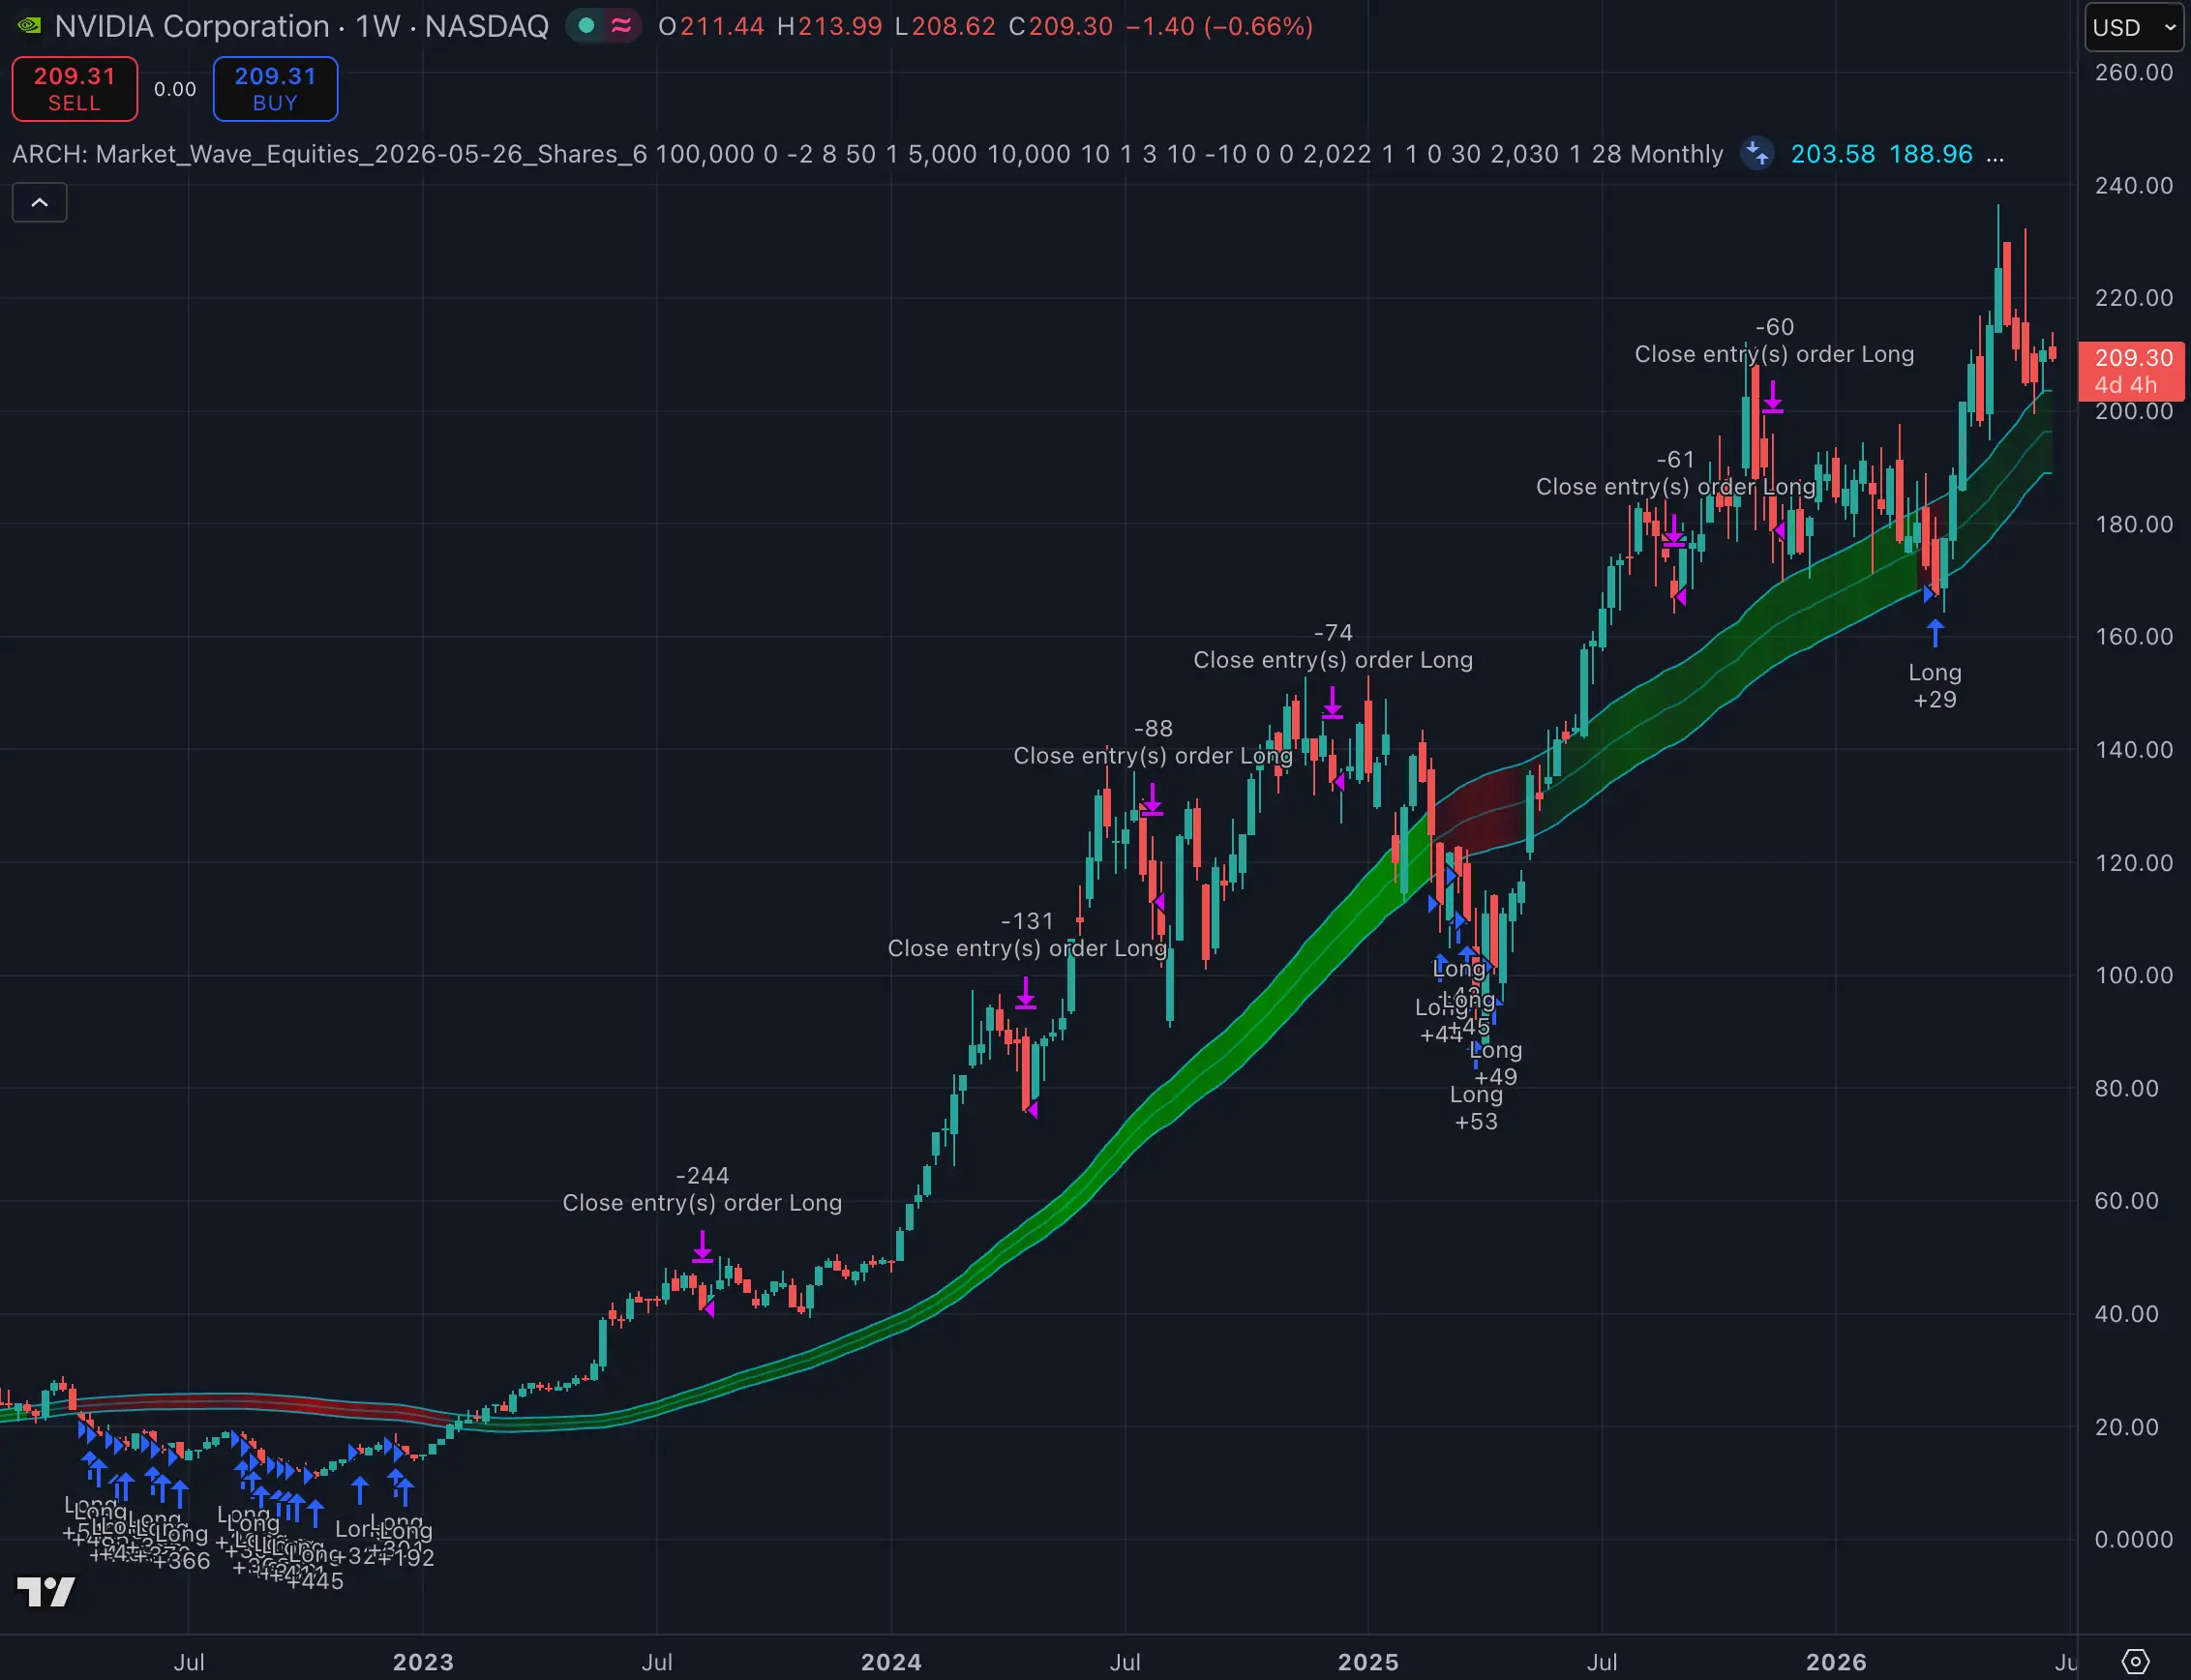
Strategy #41 · Market Wave · 1 Week chart
Backtested · 1 Jan 2022 – 22 Jun 2026
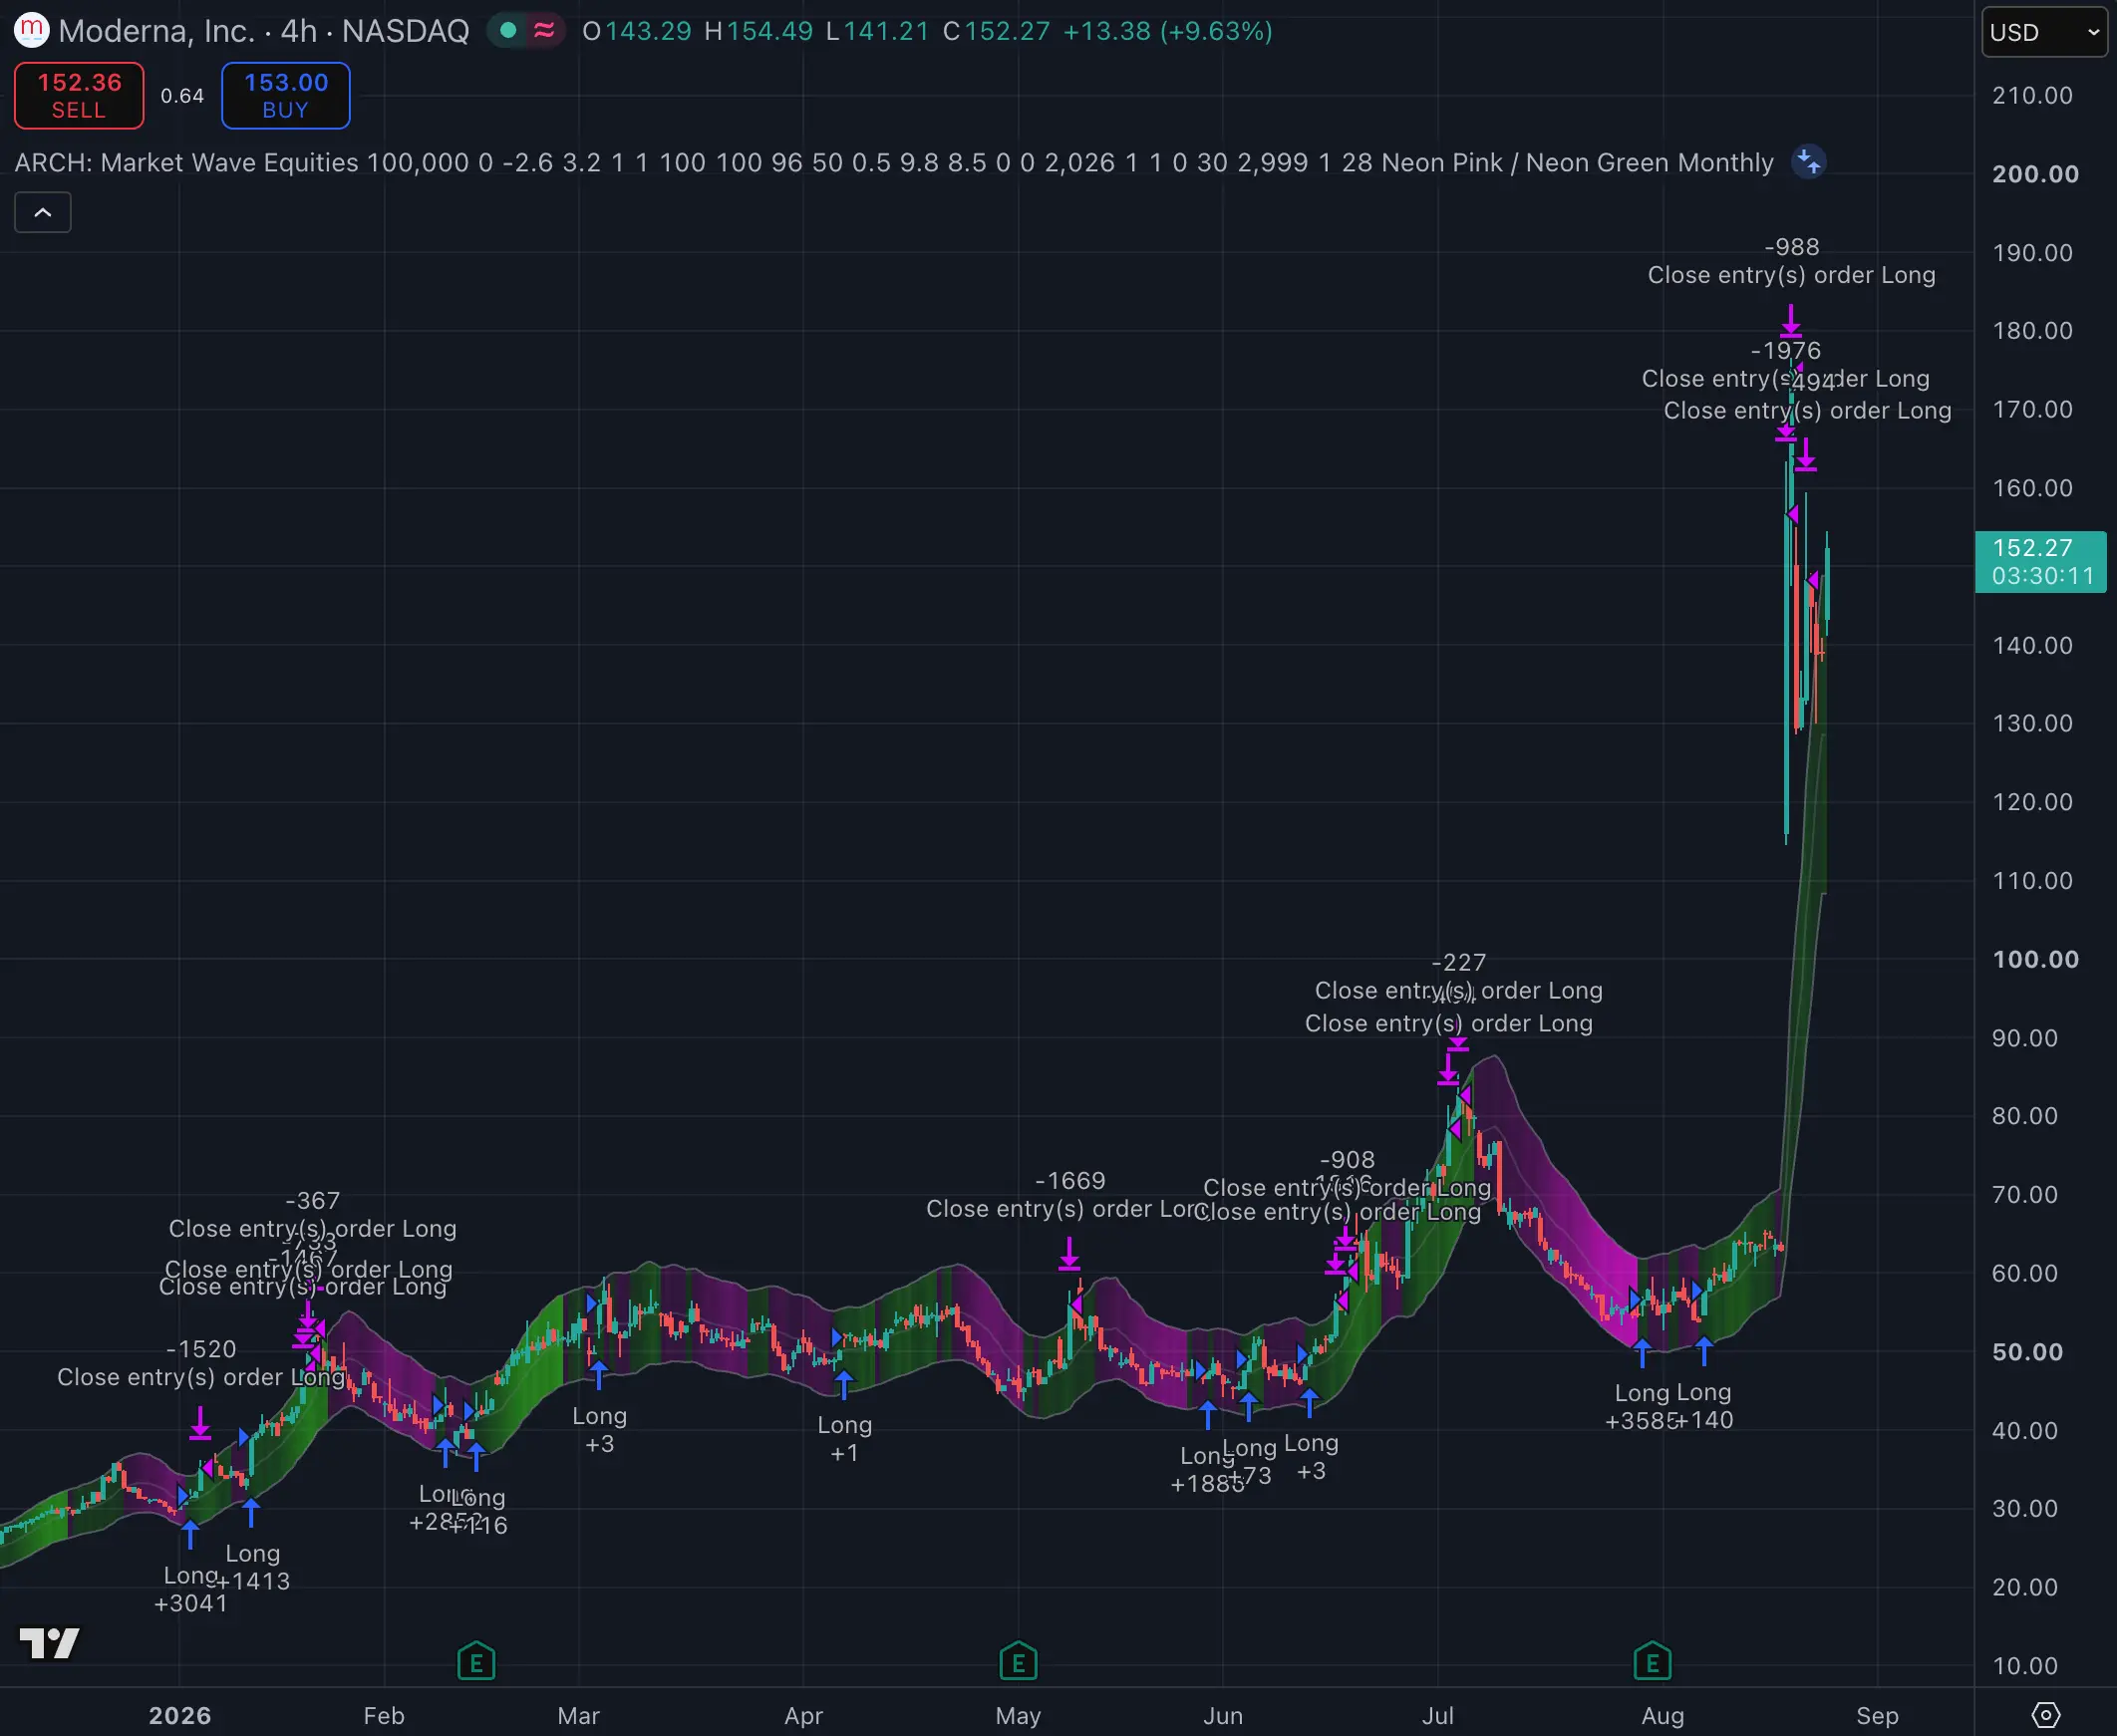
Strategy #77 · Market Wave · 4 Hours chart
Backtested · 1 Jan 2026 – 25 Aug 2026