
NVDAStocksCash yield
Buying Nvidia when it felt too high to buy
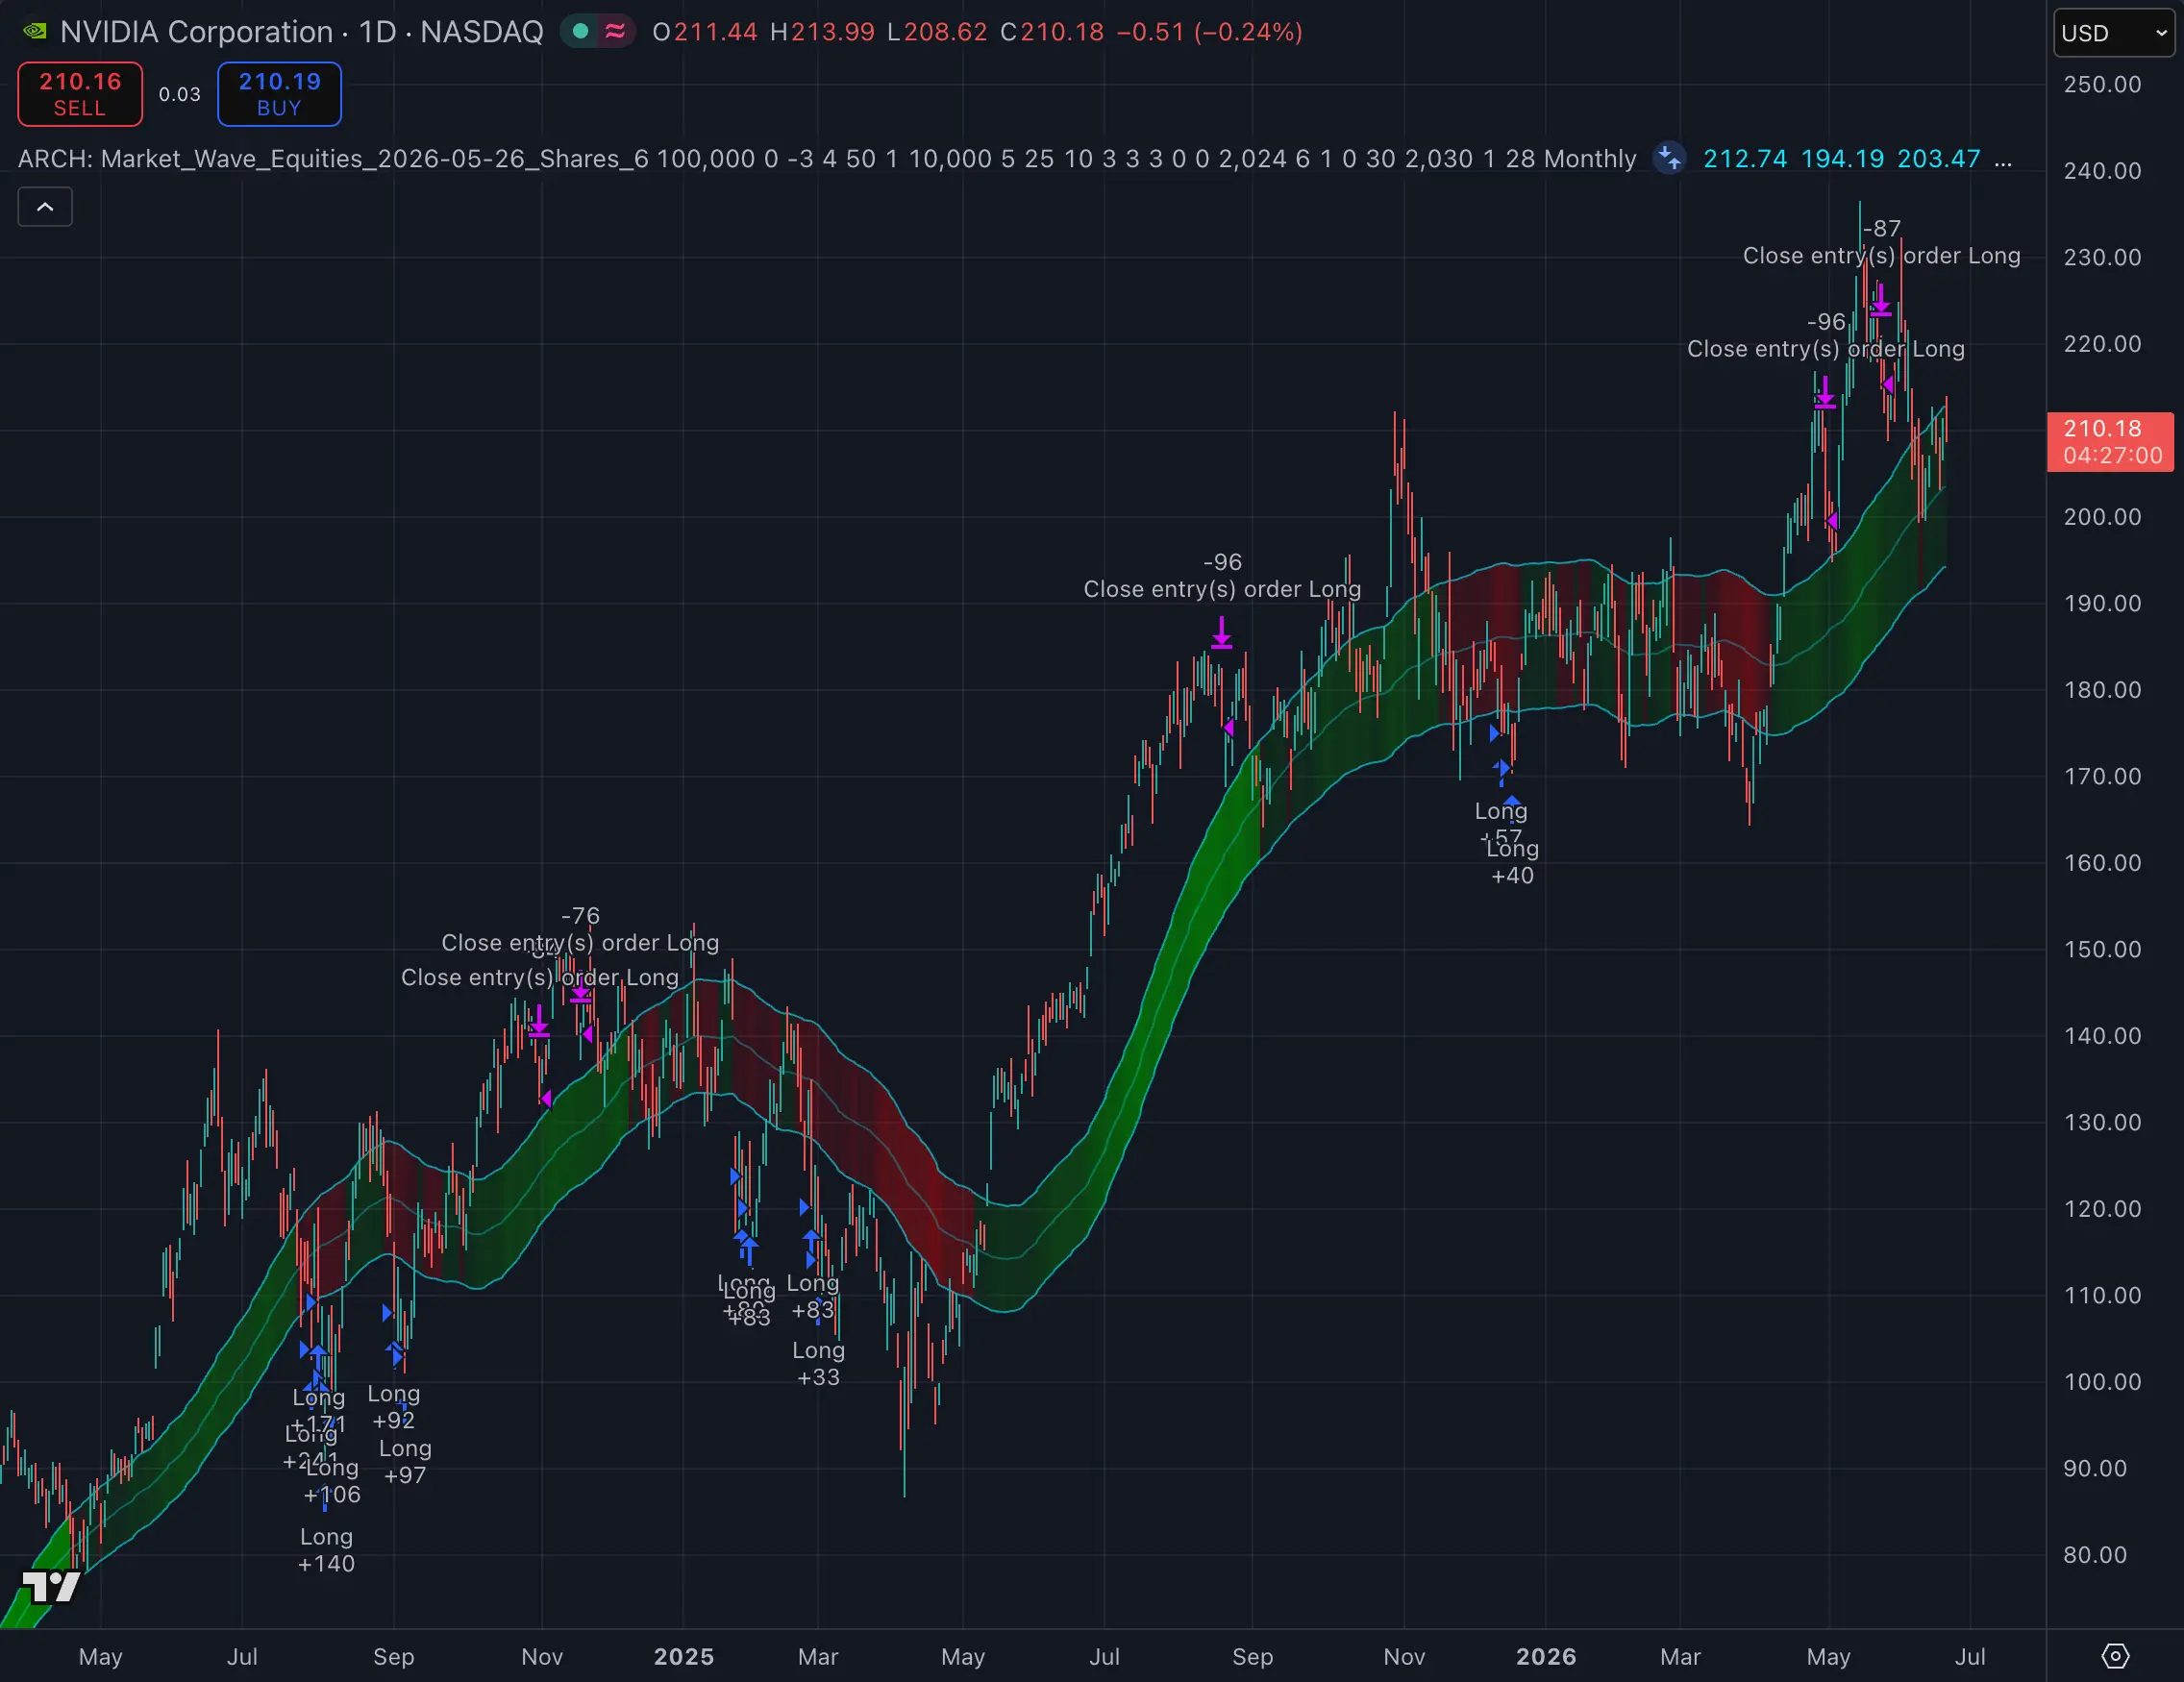
Strategy #50 · Market Wave · 1 Day chart
Strategy+102.8%
Buy and hold NVDA+82.8%
Backtested · 1 Jun 2024 – 1 Jun 2026
From the case study: Rules beat hesitation on NVDA
Strategy #100 · NVDA · 4-hour chart · Market Wave
A strategy that sells Nvidia in stages at each peak and holds the proceeds in cash.
Backtested As of 11 Nov 2026 · 1 Jan 2026 – 11 Nov 2026 · $100,000 starting capital
Strategy return
+28.5%
Buy and hold NVDA
−8.2%
Buying NVDA monthly
−13.3%
Test length
10 months
CAGR not shown under a year
Every trade from the backtest, straight from TradingView.
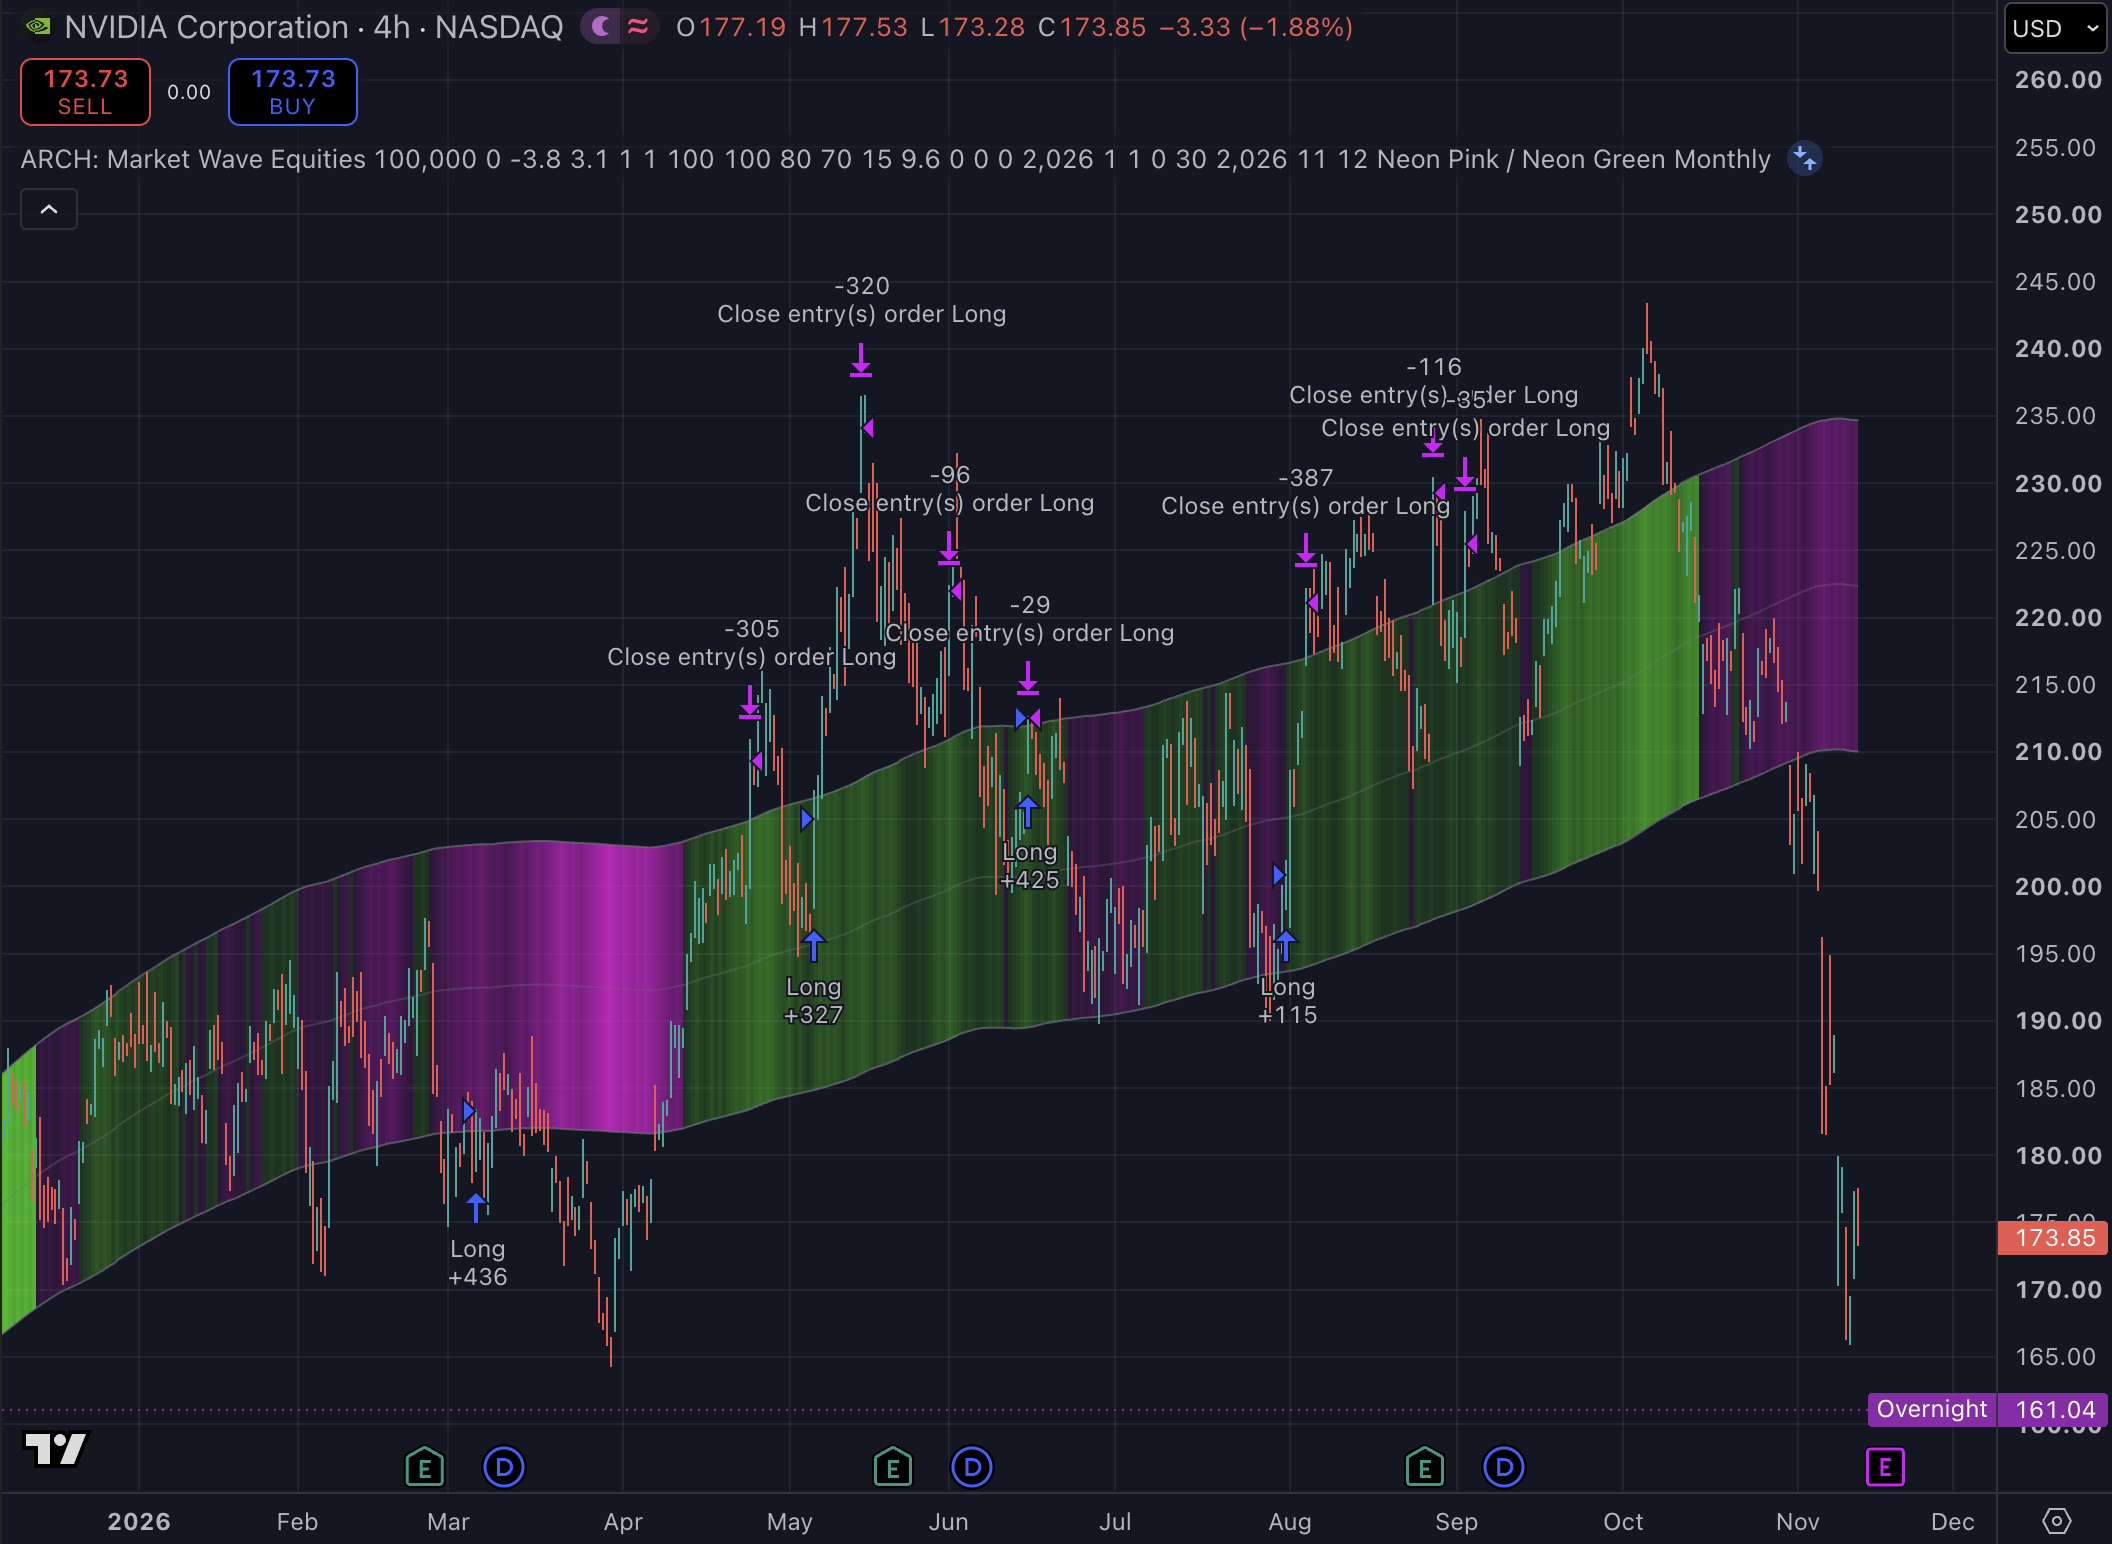
Total return over the test period, backtested.
Past and backtested performance does not guarantee future results.
Net profit
+$28,481
Ending value
$128,481
Cash profit
+$28,886
Asset accumulated
15 NVDA
From the case study
Strategy #100, Trim Nvidia at highs and step aside, is the scenario “Scale out, step aside”. Read how it played out, chart by chart.
Read the case study →The case study is dated; the results above are this strategy's published version.
On a buy signal, it puts most of its available cash into Nvidia. When the price rises above its average cost, it sells the majority of the position and keeps a smaller stake. It repeats this at each subsequent high, gradually shifting the portfolio to cash, then re-enters when the next buy signal appears.
Exact settings come with every client account, the free tier included, in Strategy Lab Pro.
Start freeStrategy #50 · Market Wave · 1 Day chart
Backtested · 1 Jun 2024 – 1 Jun 2026
From the case study: Rules beat hesitation on NVDA
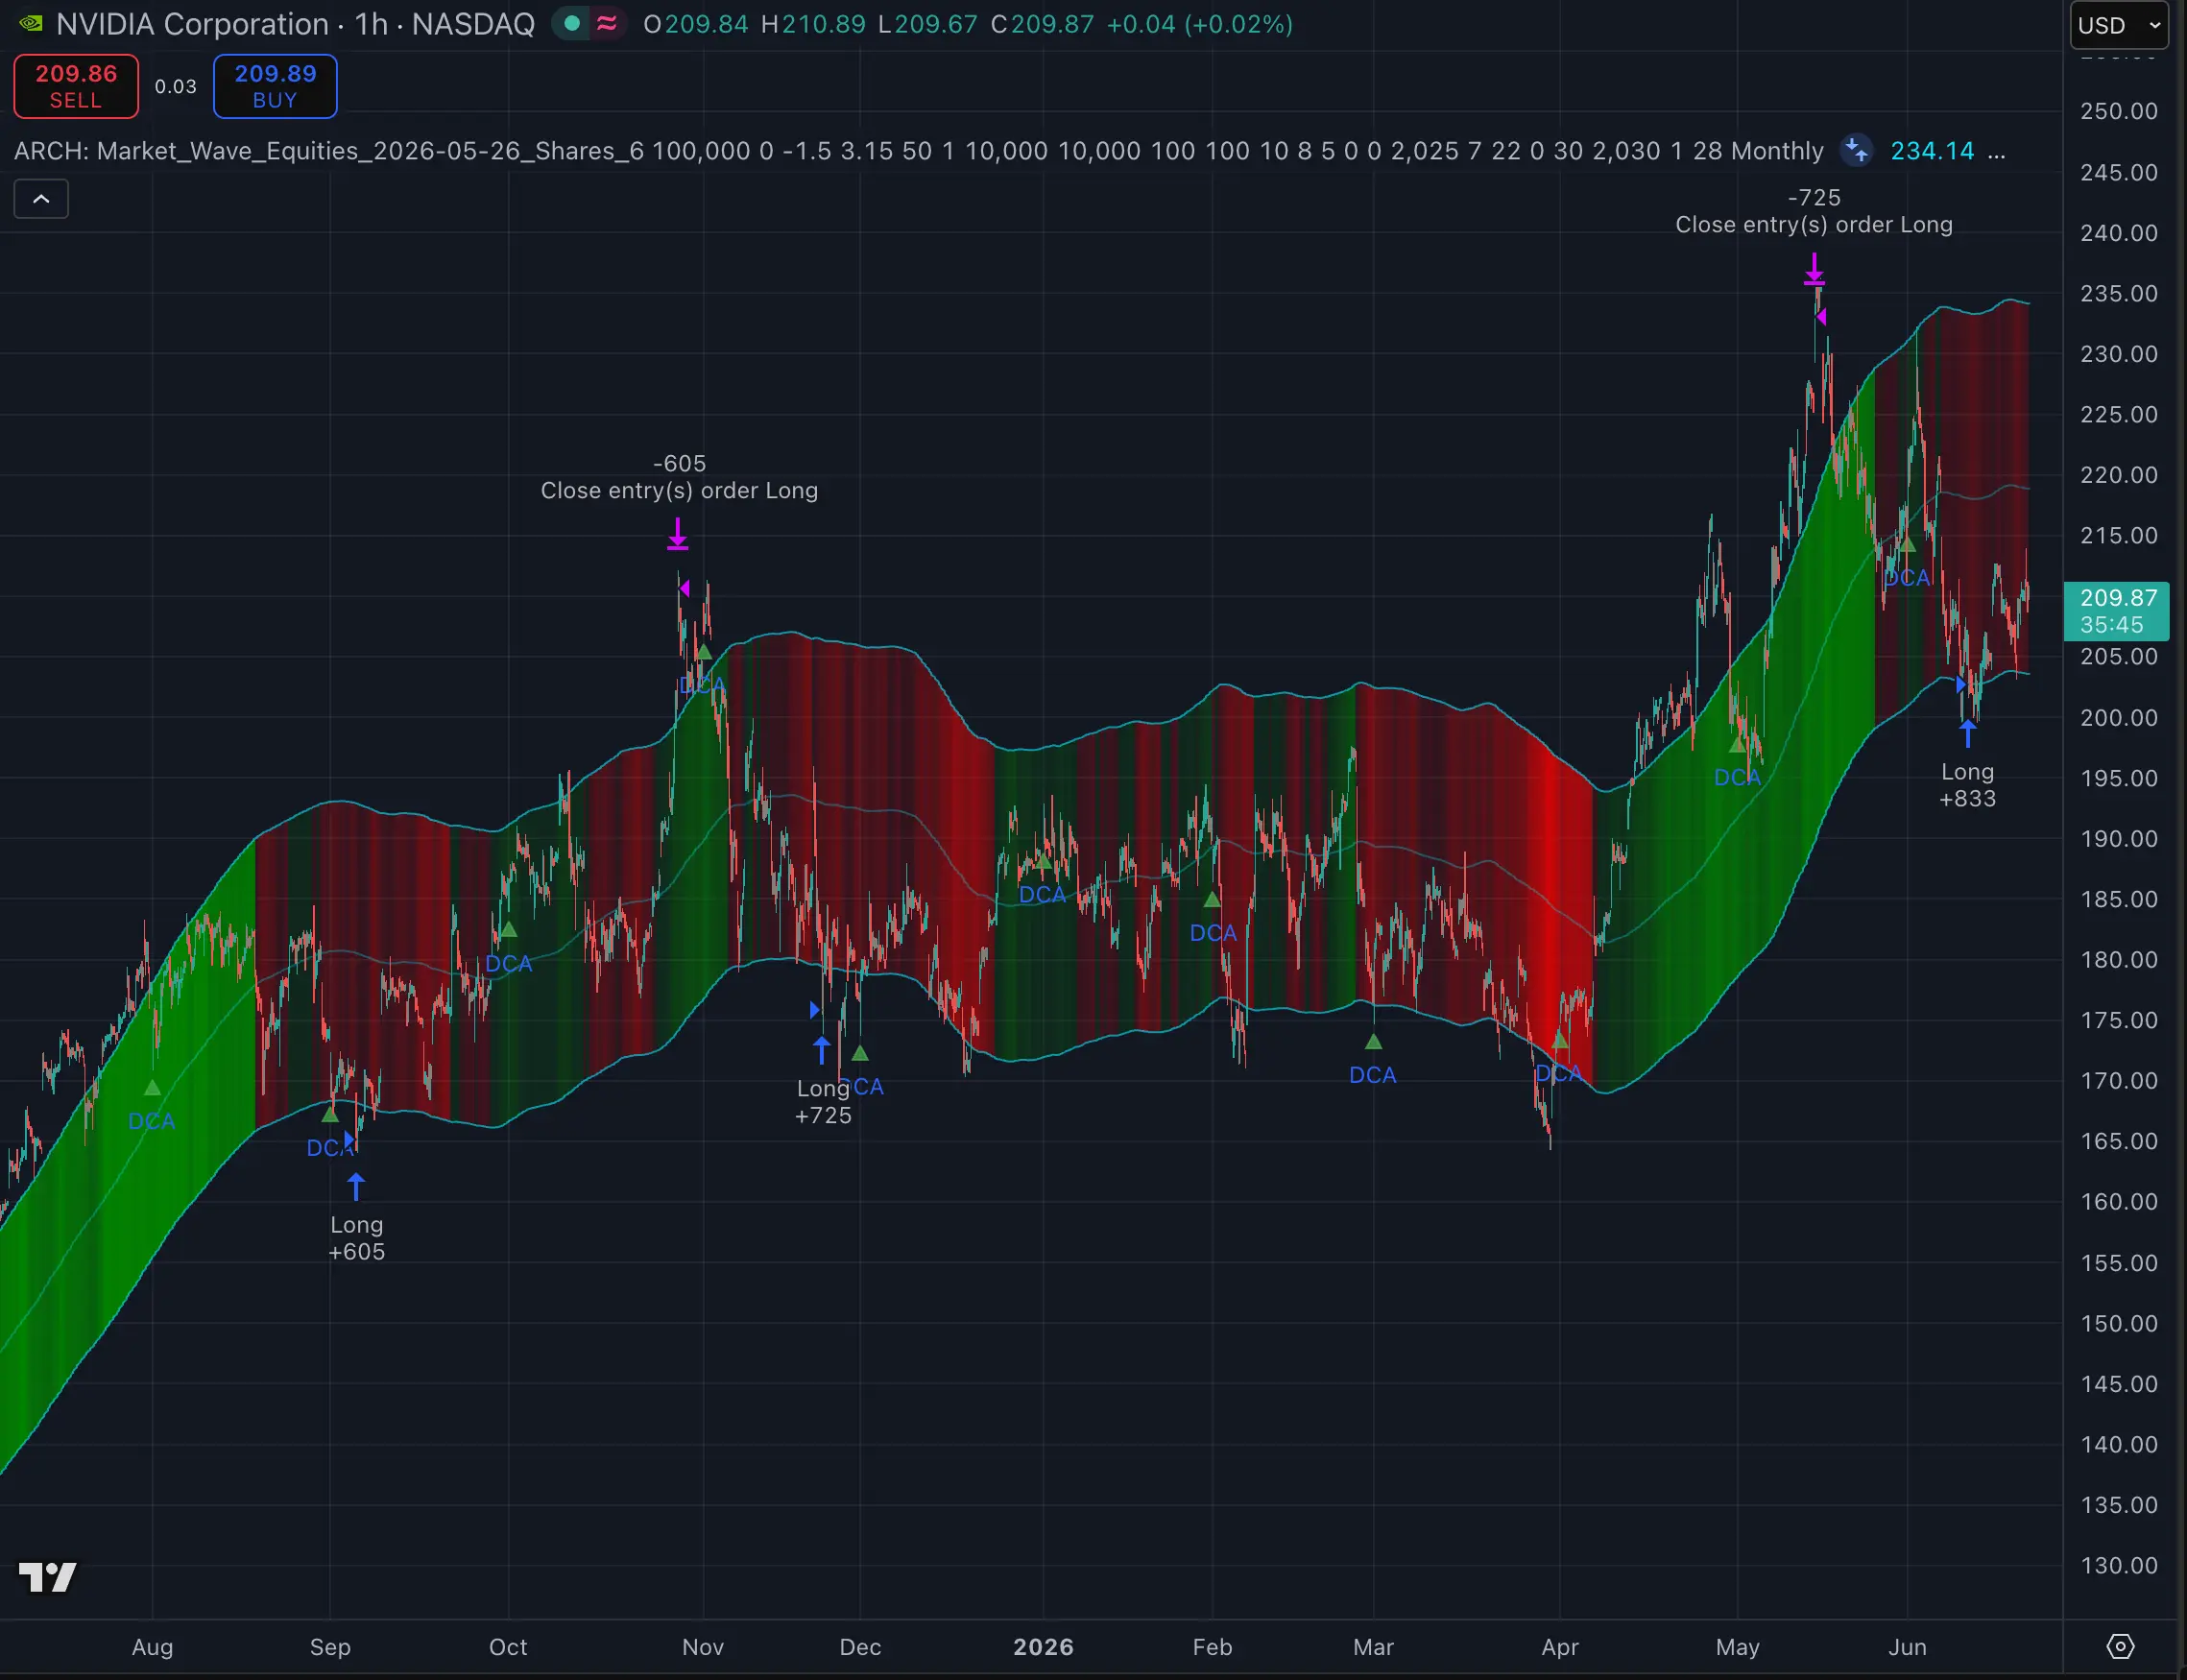
Strategy #51 · Market Wave · 1 Hour chart
Backtested · 22 Jul 2025 – 22 Jul 2026
From the case study: Rules beat hesitation on NVDA
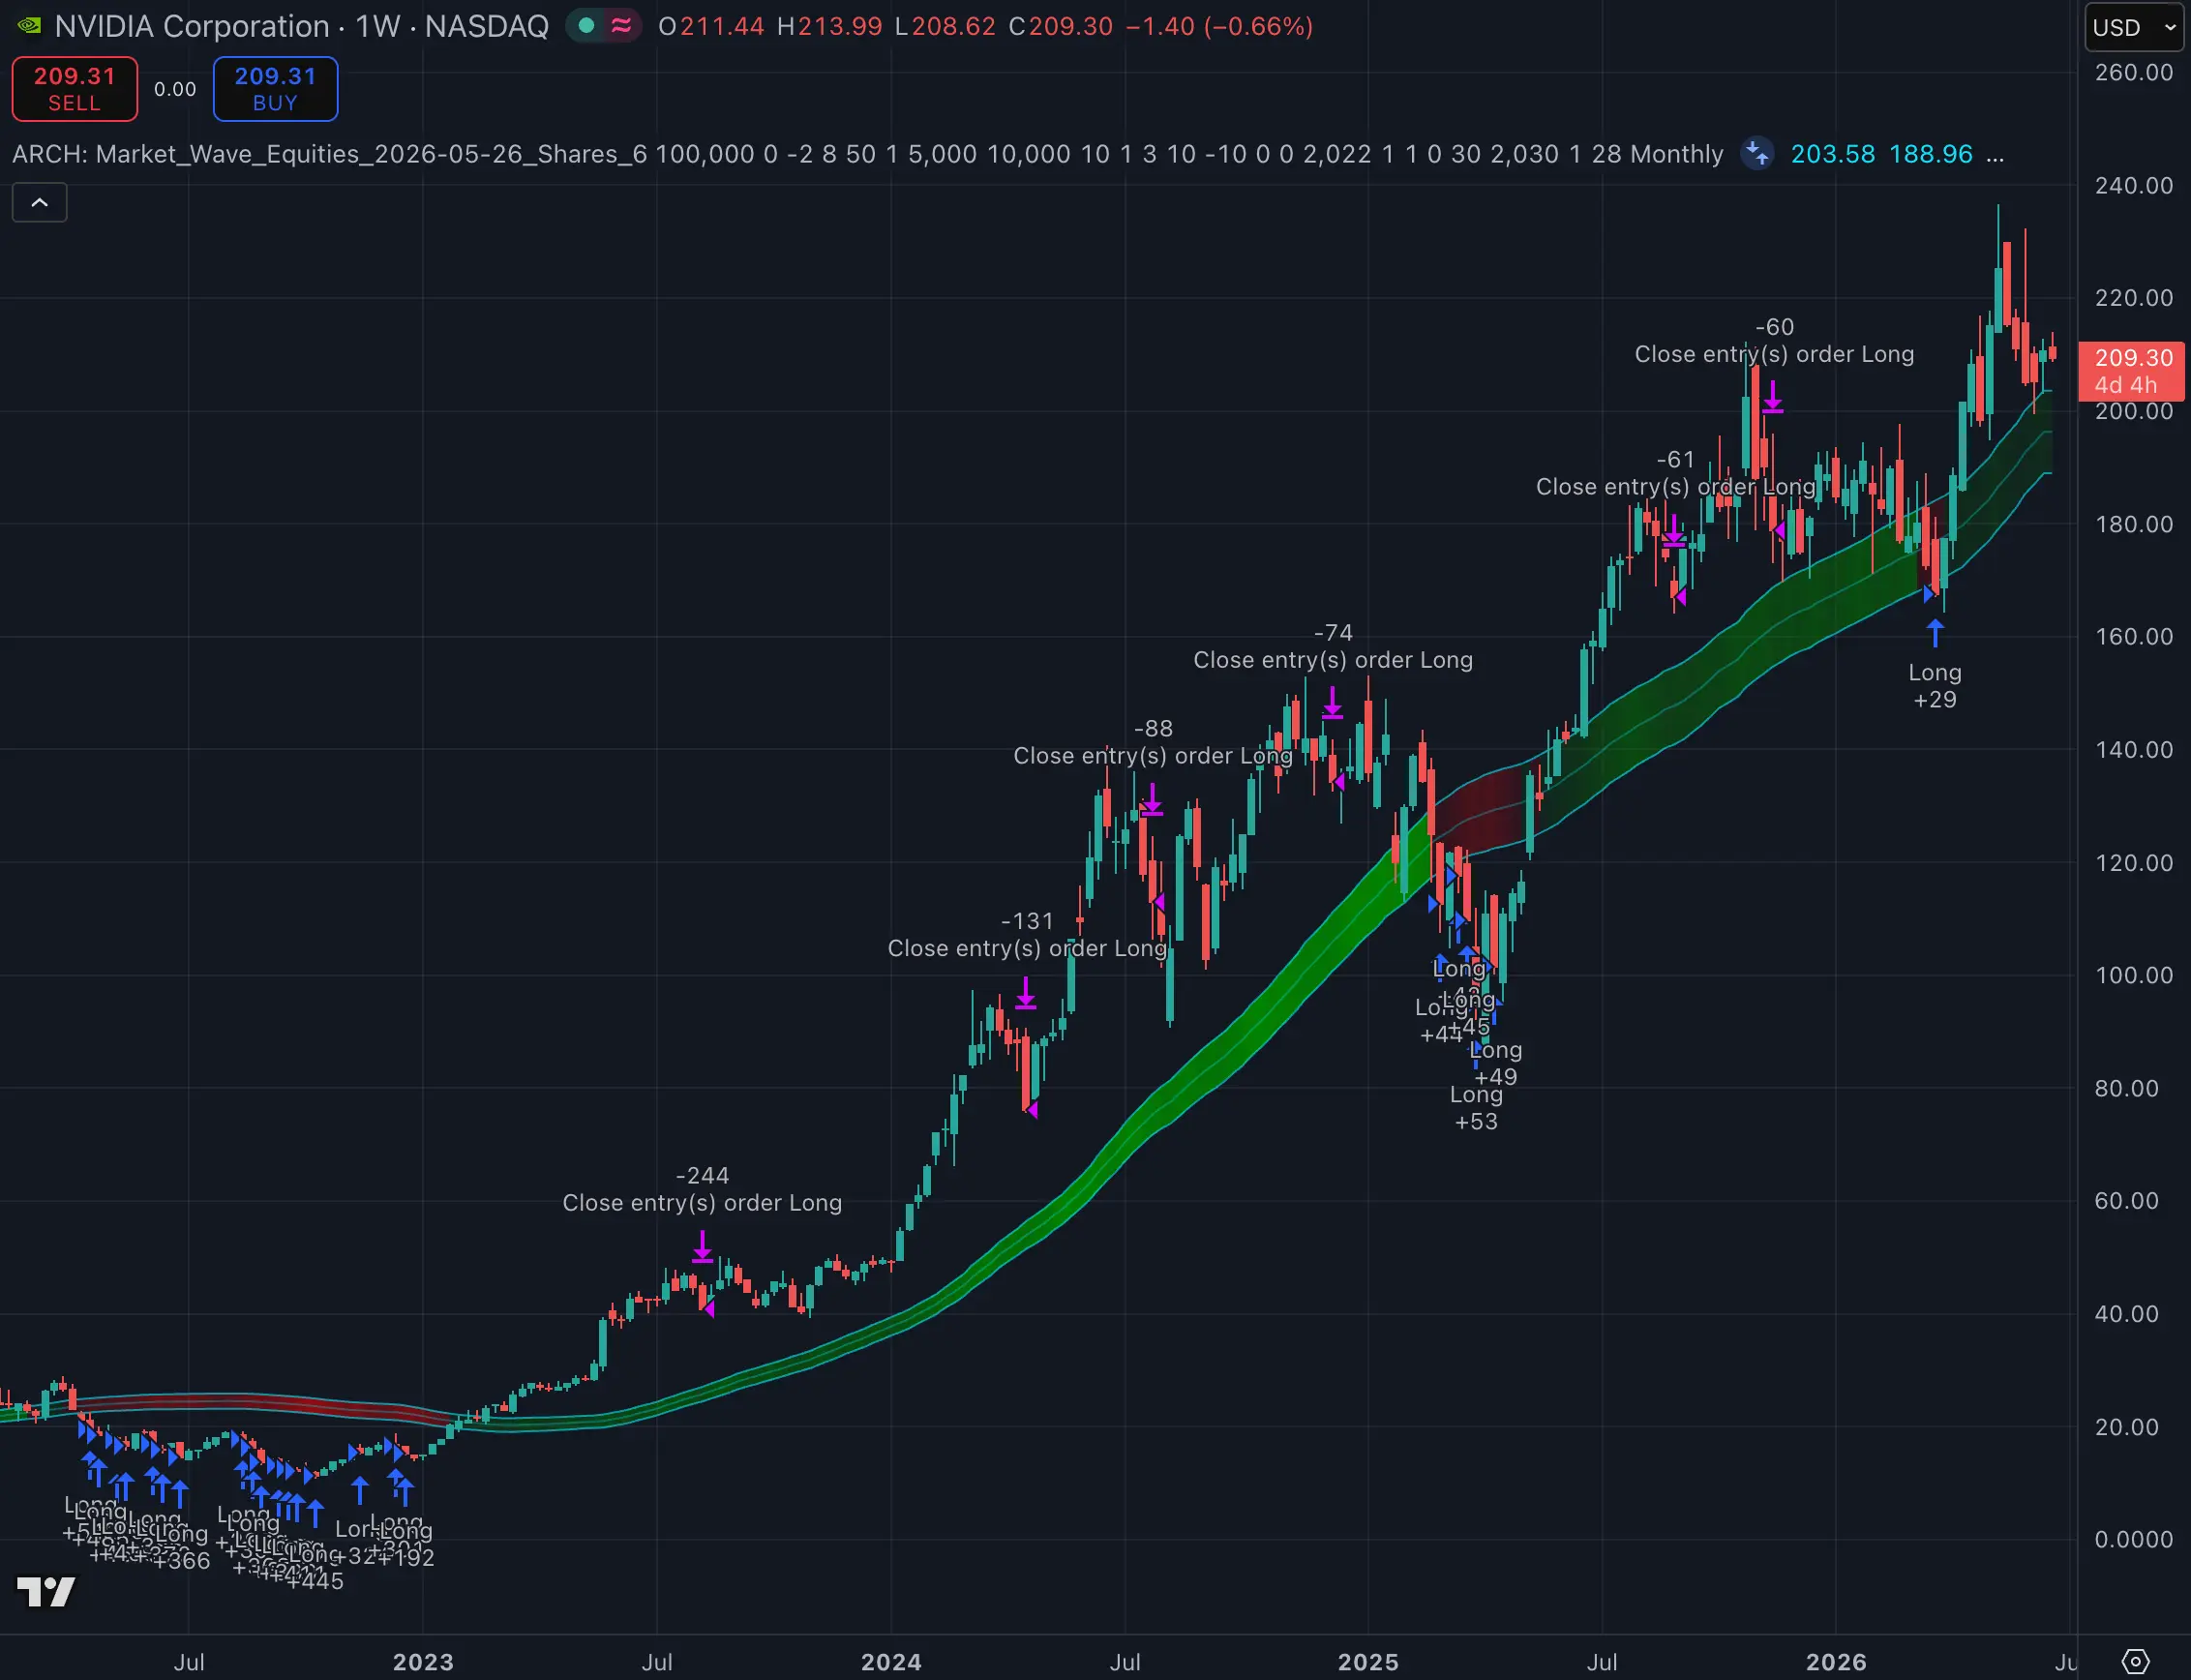
Strategy #41 · Market Wave · 1 Week chart
Backtested · 1 Jan 2022 – 22 Jun 2026
From the case study: Rules beat hesitation on NVDA